American Statistical Association DataFest (CourseKata)
The dataset analyzed at the ASA DataFest was by CourseKata, an organization that authored an online textbook for students to learn statistics and data science. There are 16 chapters in the textbook with exercises and an end of chapter assessment.

Textbook Insights
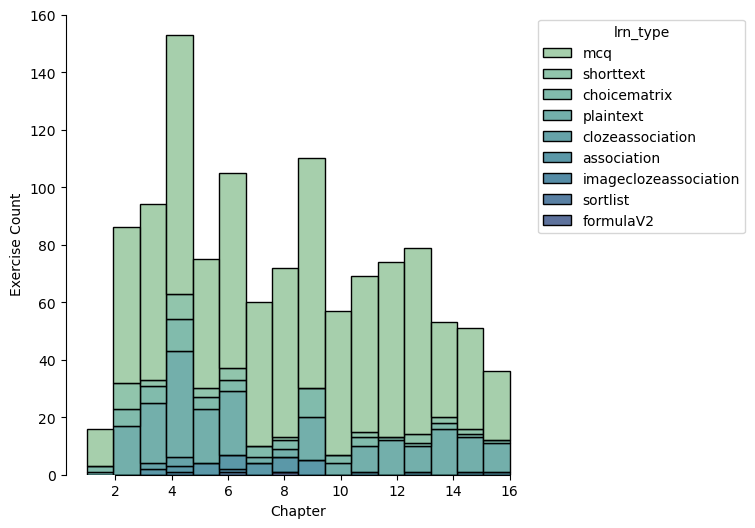
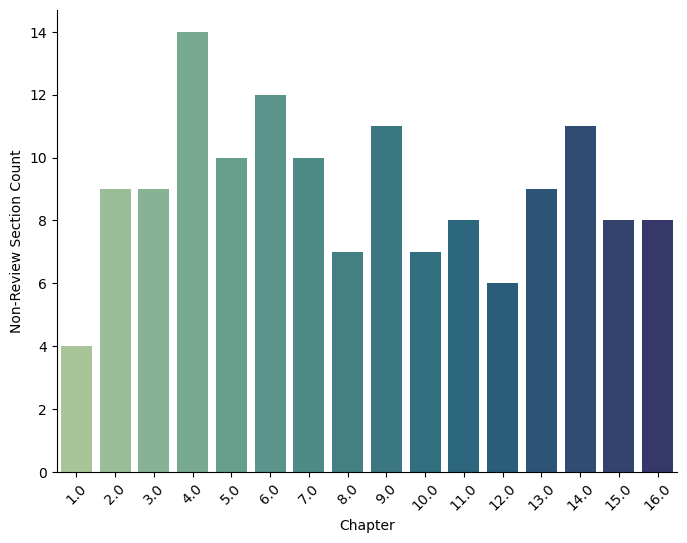
The chapter with the largest number of exercises is Chapter 4 which dives into ideas about variance (Fig. 1). Chapter 4 also has the greatest number of non-review sections in the chapter (sections devoted to learning and not review), implying more content to go over and more pages of the textbook to view (Fig. 2).
 |
 |
| Figure 1: Distribution of exercises in the 16 chapters of the textbook |
Figure 2 : Number of non-review sections in each chapter |
User Insights
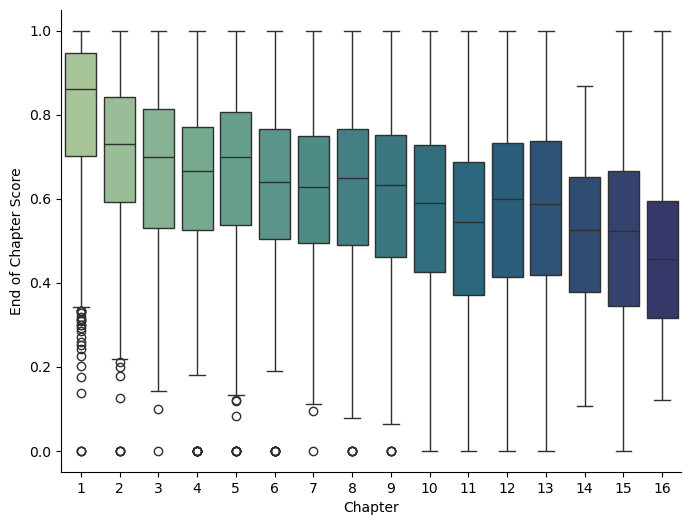
An observation that can be made is that there is a decrease in chapter test scores as users get deeper into the book. This drop in end of chapter scores may imply that the book becomes more difficult for students as they learn more content. Another possibility is that the nature of the learning material is cumulative and mastery of previous material is necessary to succeed (Fig. 3).
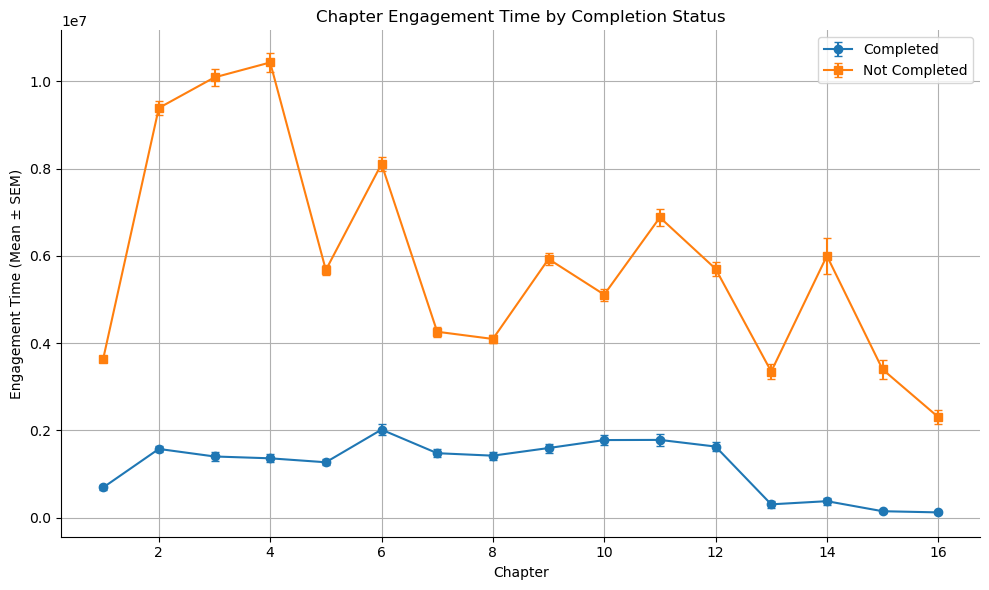
In deliving deeper into how much “engagement” time is spent on engaging with the textbook, we see that students tend to spend the same amount of time reviewing the content of a chapter after it is completed once. This can imply that students tend to have a hard cap on how much time they want to devote to reviewing a finished chapter, even if there are varying amounts of sections across chapters (Fig. 4).
 |
 |
| Figure 3: Distribution of end of chapter scores for every chapter |
Figure 4: Scatterplot of students’ engagement time with textbook given if the page was completed before or not |
Through this, I was interested in seeing if successful students using the textbook exhibited similar behaviors and how the allocation of study time on sections in a chapter would affect performance on the review pages at the end of the chapter.
Feature Engineering
In preprocessing the dataset, I elected to only look into sections that were not end of chapter review (these sections were denoted with review_flag == false) to emphasize sections where students were studying or learning the content.
Students were assumed to be engaged with the material when they initiated an action on their computer such as a click, mouse movement, scroll for every 2 minutes. On the other hand, we assumed students to be unengaged with the textbook when they were idle or off page. Such metrics were calculated for every ith chapter and jth section
\[Engaged_{ij} = \sum engaged\]
\[Unengaged_{ij} = \sum idle\_{brief} + \sum idle\_{long} + \sum off\_{page\_brief} + \sum off\_{page\_long}\]
\[Total\ Time_{ij} = Engaged_{ij} + Unengaged_{ij}\]
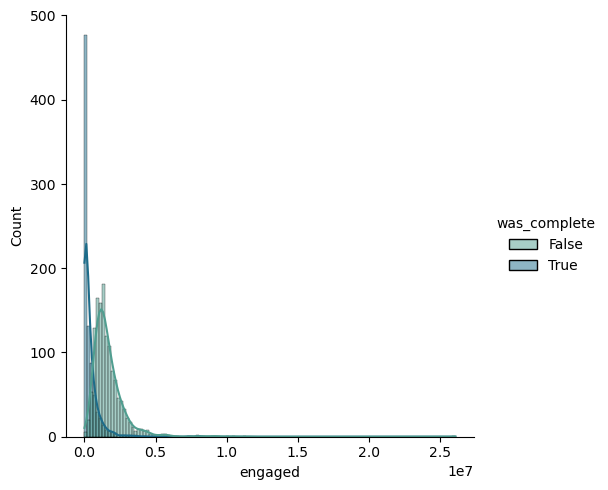
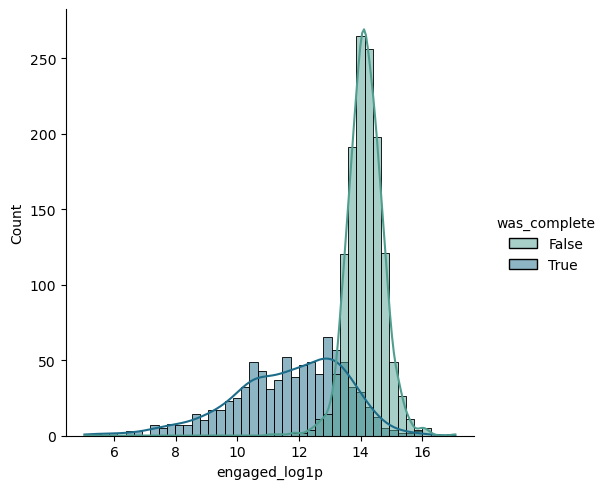
One shortcoming of looking at students’ raw time data was that the data was largely right-skewed, perhaps due to some students leaving the textbook open in the background of their web browser. To rectify the skew, log transforms were used.
\[Engaged\ Log_{ij} = \log(1+Engaged_{ij})\]
\[Total\ Log_{ij} = \log(Total_{ij})\]
 |
 |
| Figure 3: Distribution of Engagement Time with Chapter 2, Section 4 |
Figure 4: Distribution of Engagement Time with Chapter 2, Section 4 after log transform: log(1+x) |
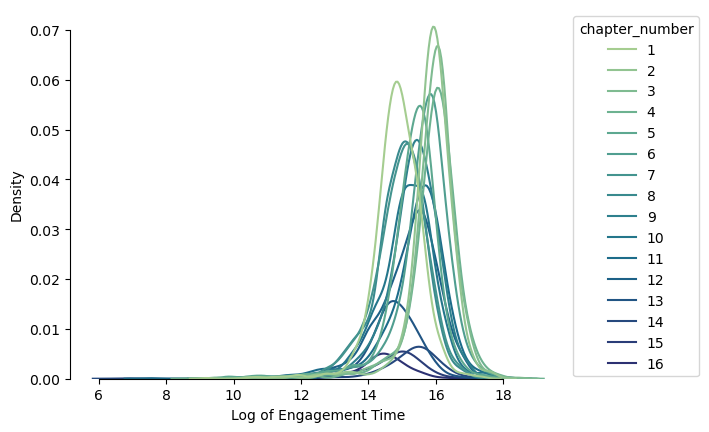
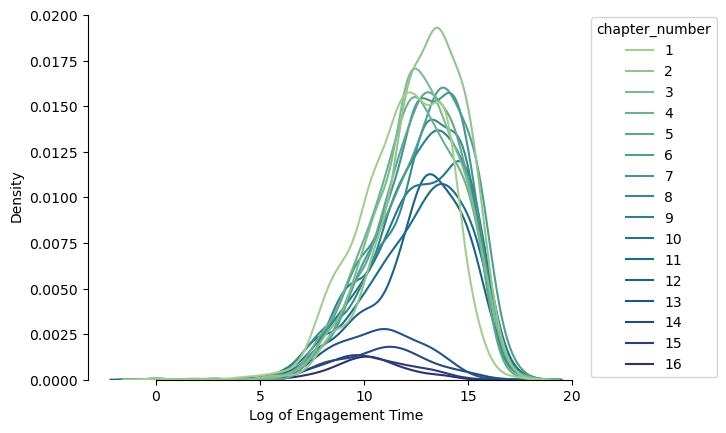
To delve deeper into observations made in Fig. 4, we approximated the Kernel Density Estimate for the log of chapter engagement times. We can generalize that the distribution of engagement times for students studying a chapter, pre-completion, has smaller tails and larger peaks (Fig. 5). On the other hand, there is more variance when students are engaging with the book post-completion of a chapter (Fig. 6).
 |
 |
| Figure 5: Distribution of log of students’ engagement times when page is not yet completed |
Figure 6: Distrubtion of log of students’ engagement times when page is completed |
Section Engagement Ratio was calculated to see if there were particular sections where engagement was low. Fig. 7 shows that there are not statistically significant sections where students were particularily unengaged.
\[Section\ Engagement\ Ratio_{ij} = \frac{Engaged_{ij}}{Total\ Time_{ij}}\]
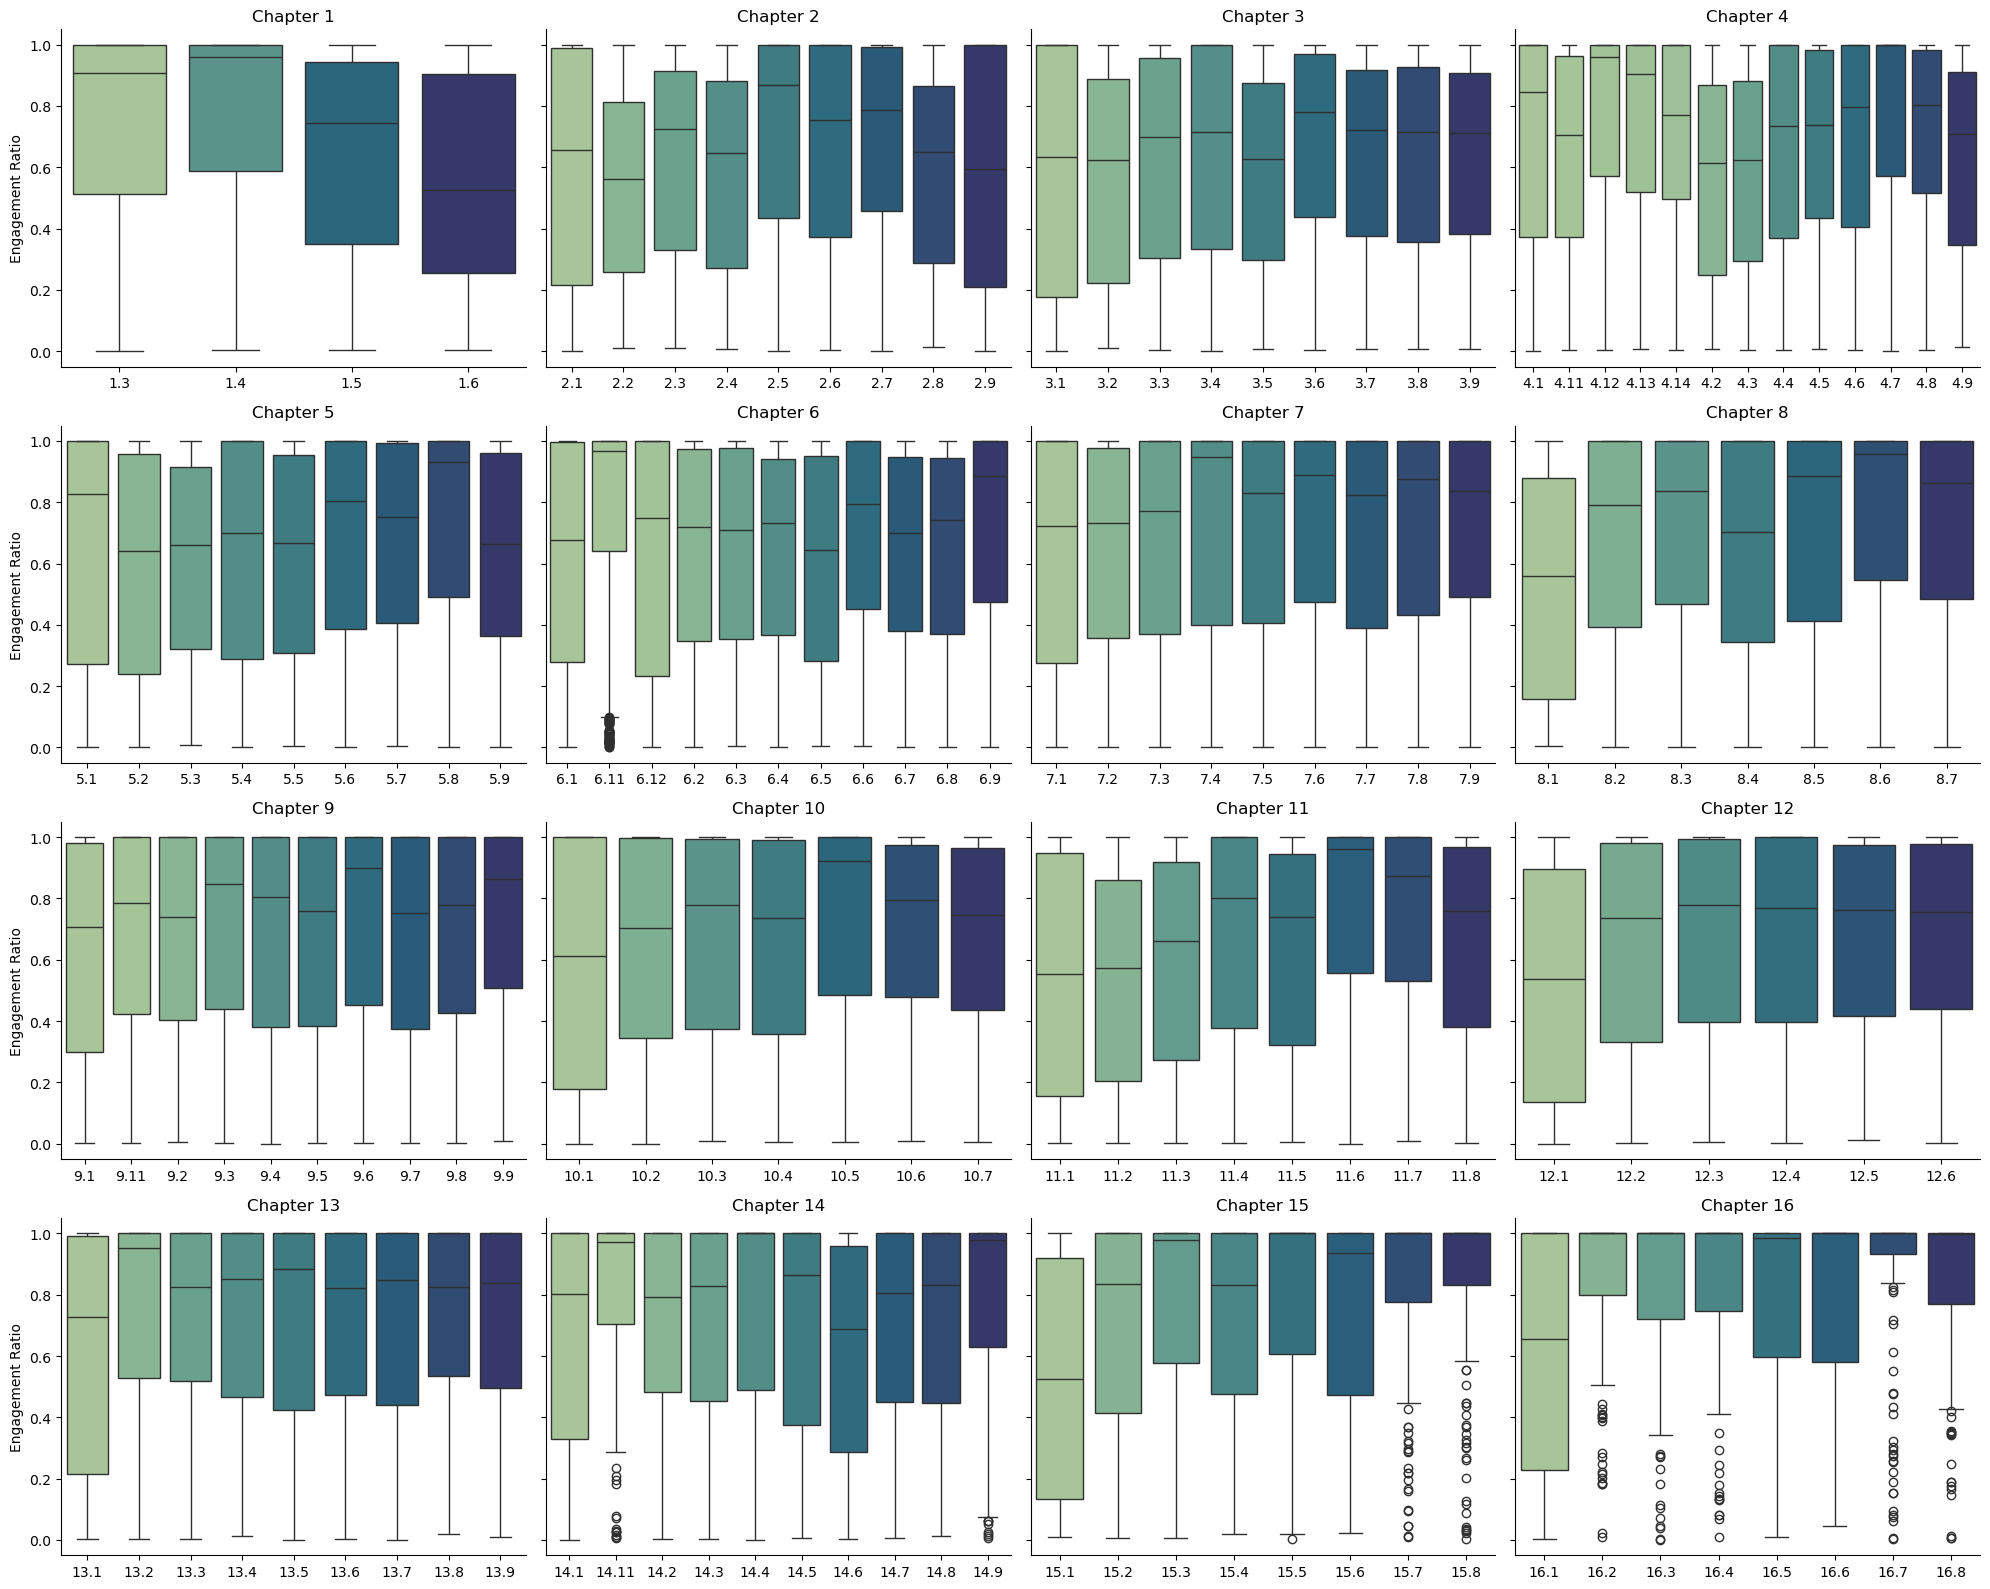 |
| Figure 7: Distributions of non-review section engagement for each chapter of the CourseKata textbook, before page completion |
On the other hand, Relative Section Engagement Ratio was calculated to see how different students allocated their time and emphasized different sections for their needs.
\[Relative\ Section\ Engagement\ Ratio = \frac{Engaged_{ij}}{Engaged_{i}}\]
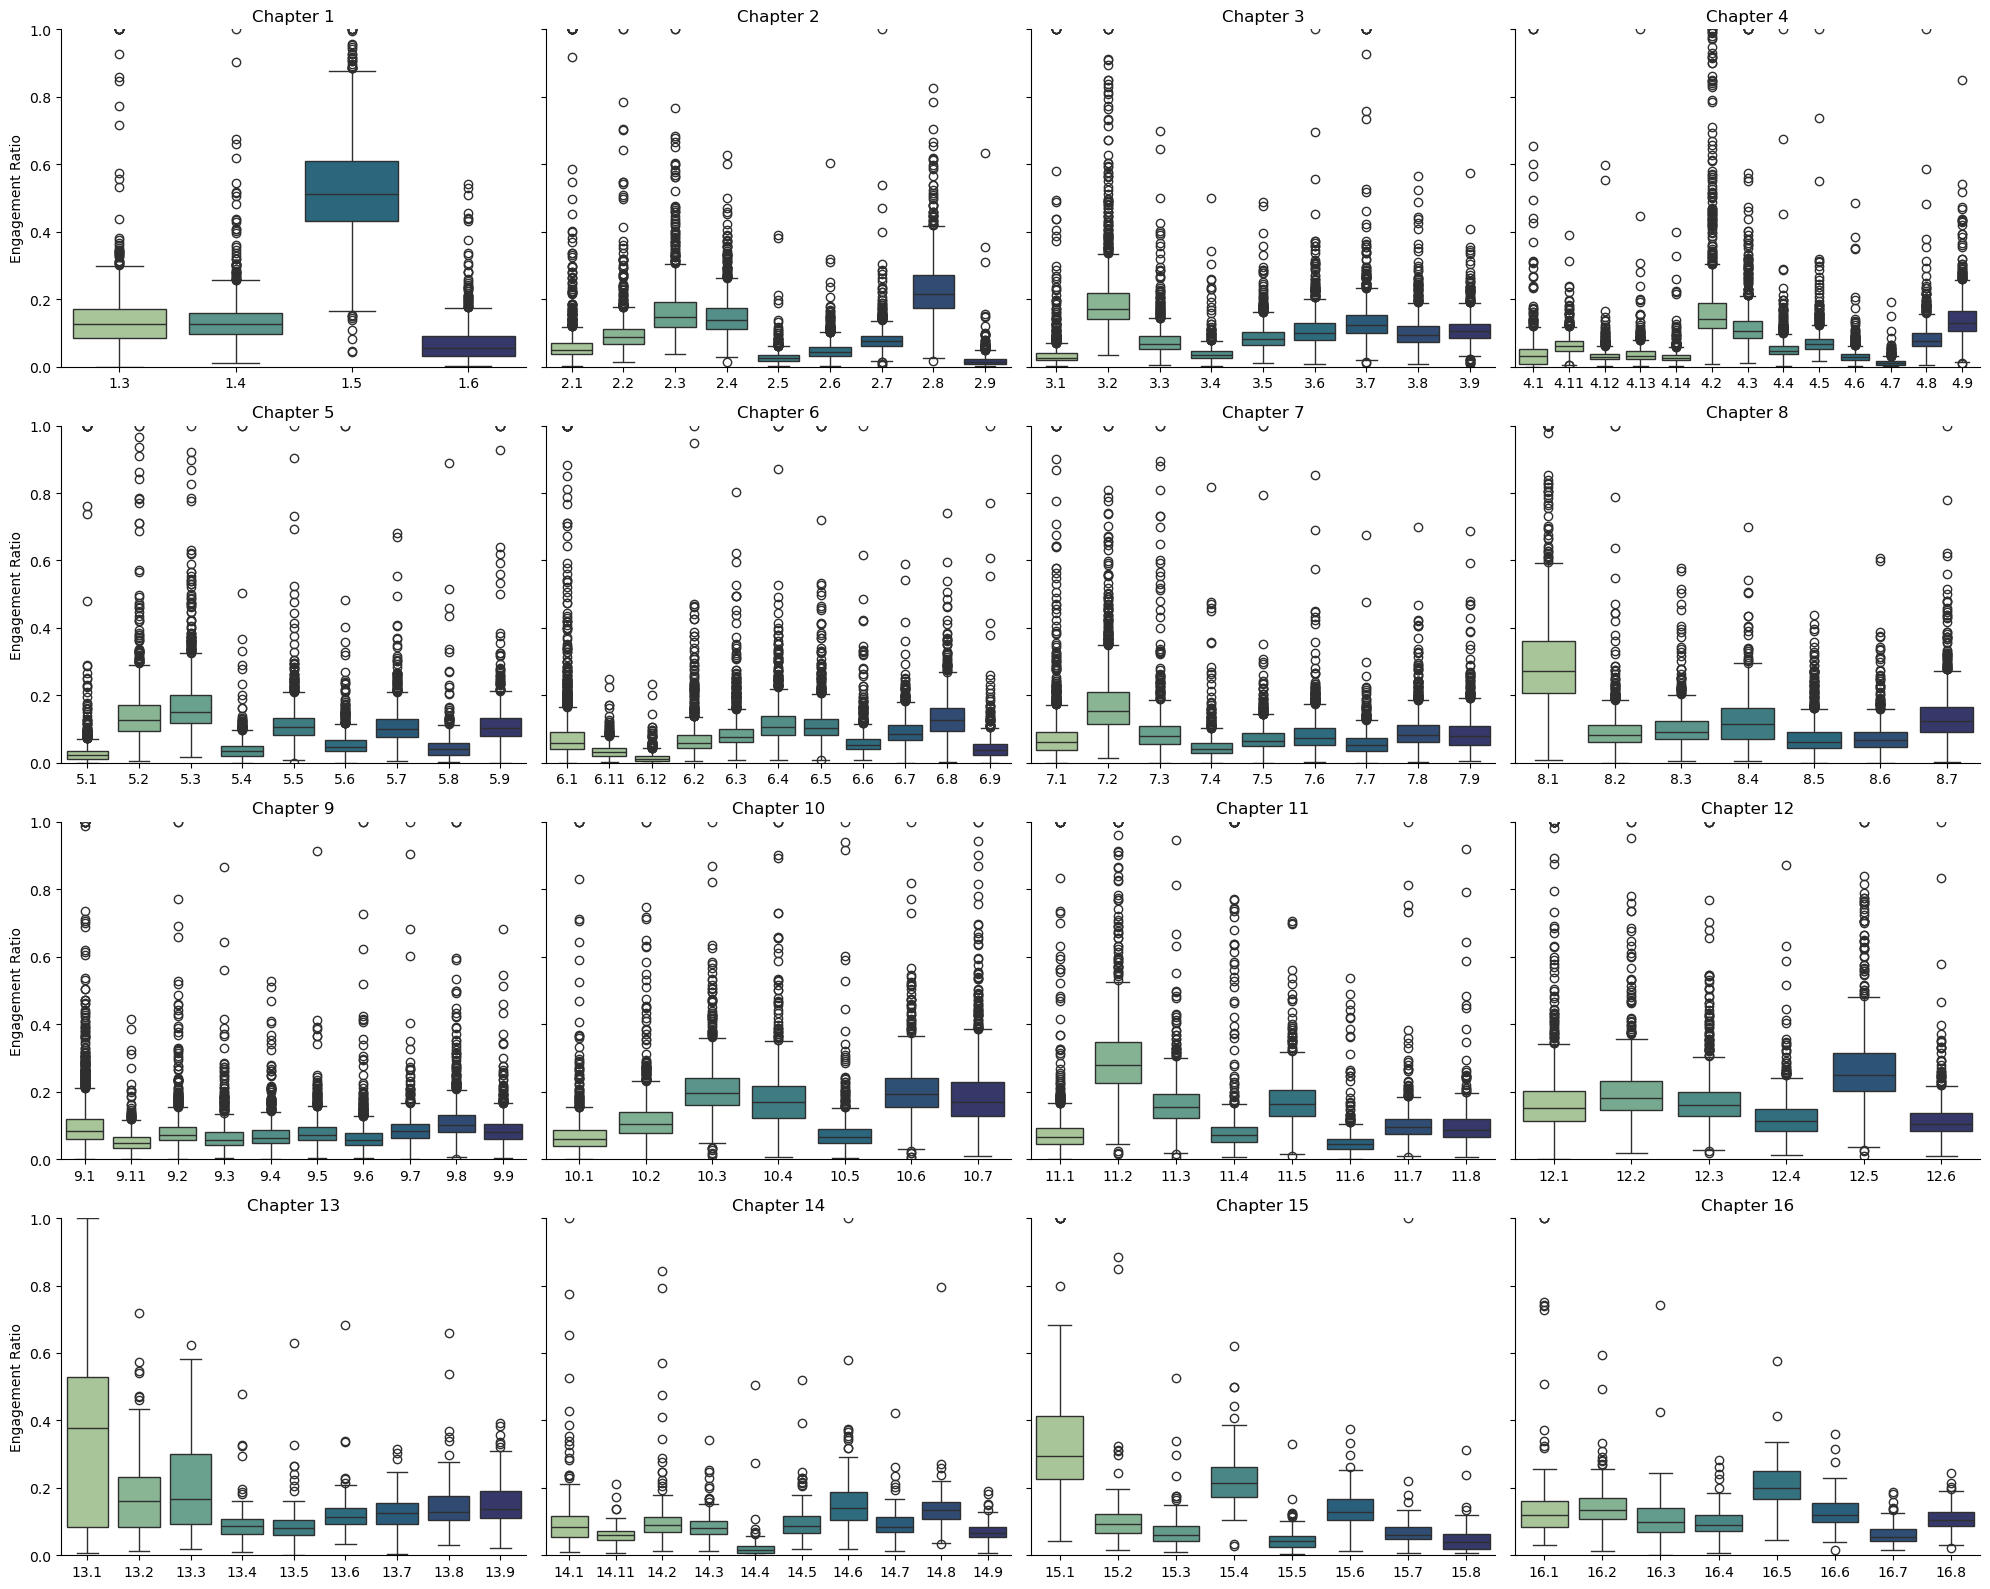 |
| Figure 8: Distributions of relative page engagement for each chapter of the CourseKata textbook |
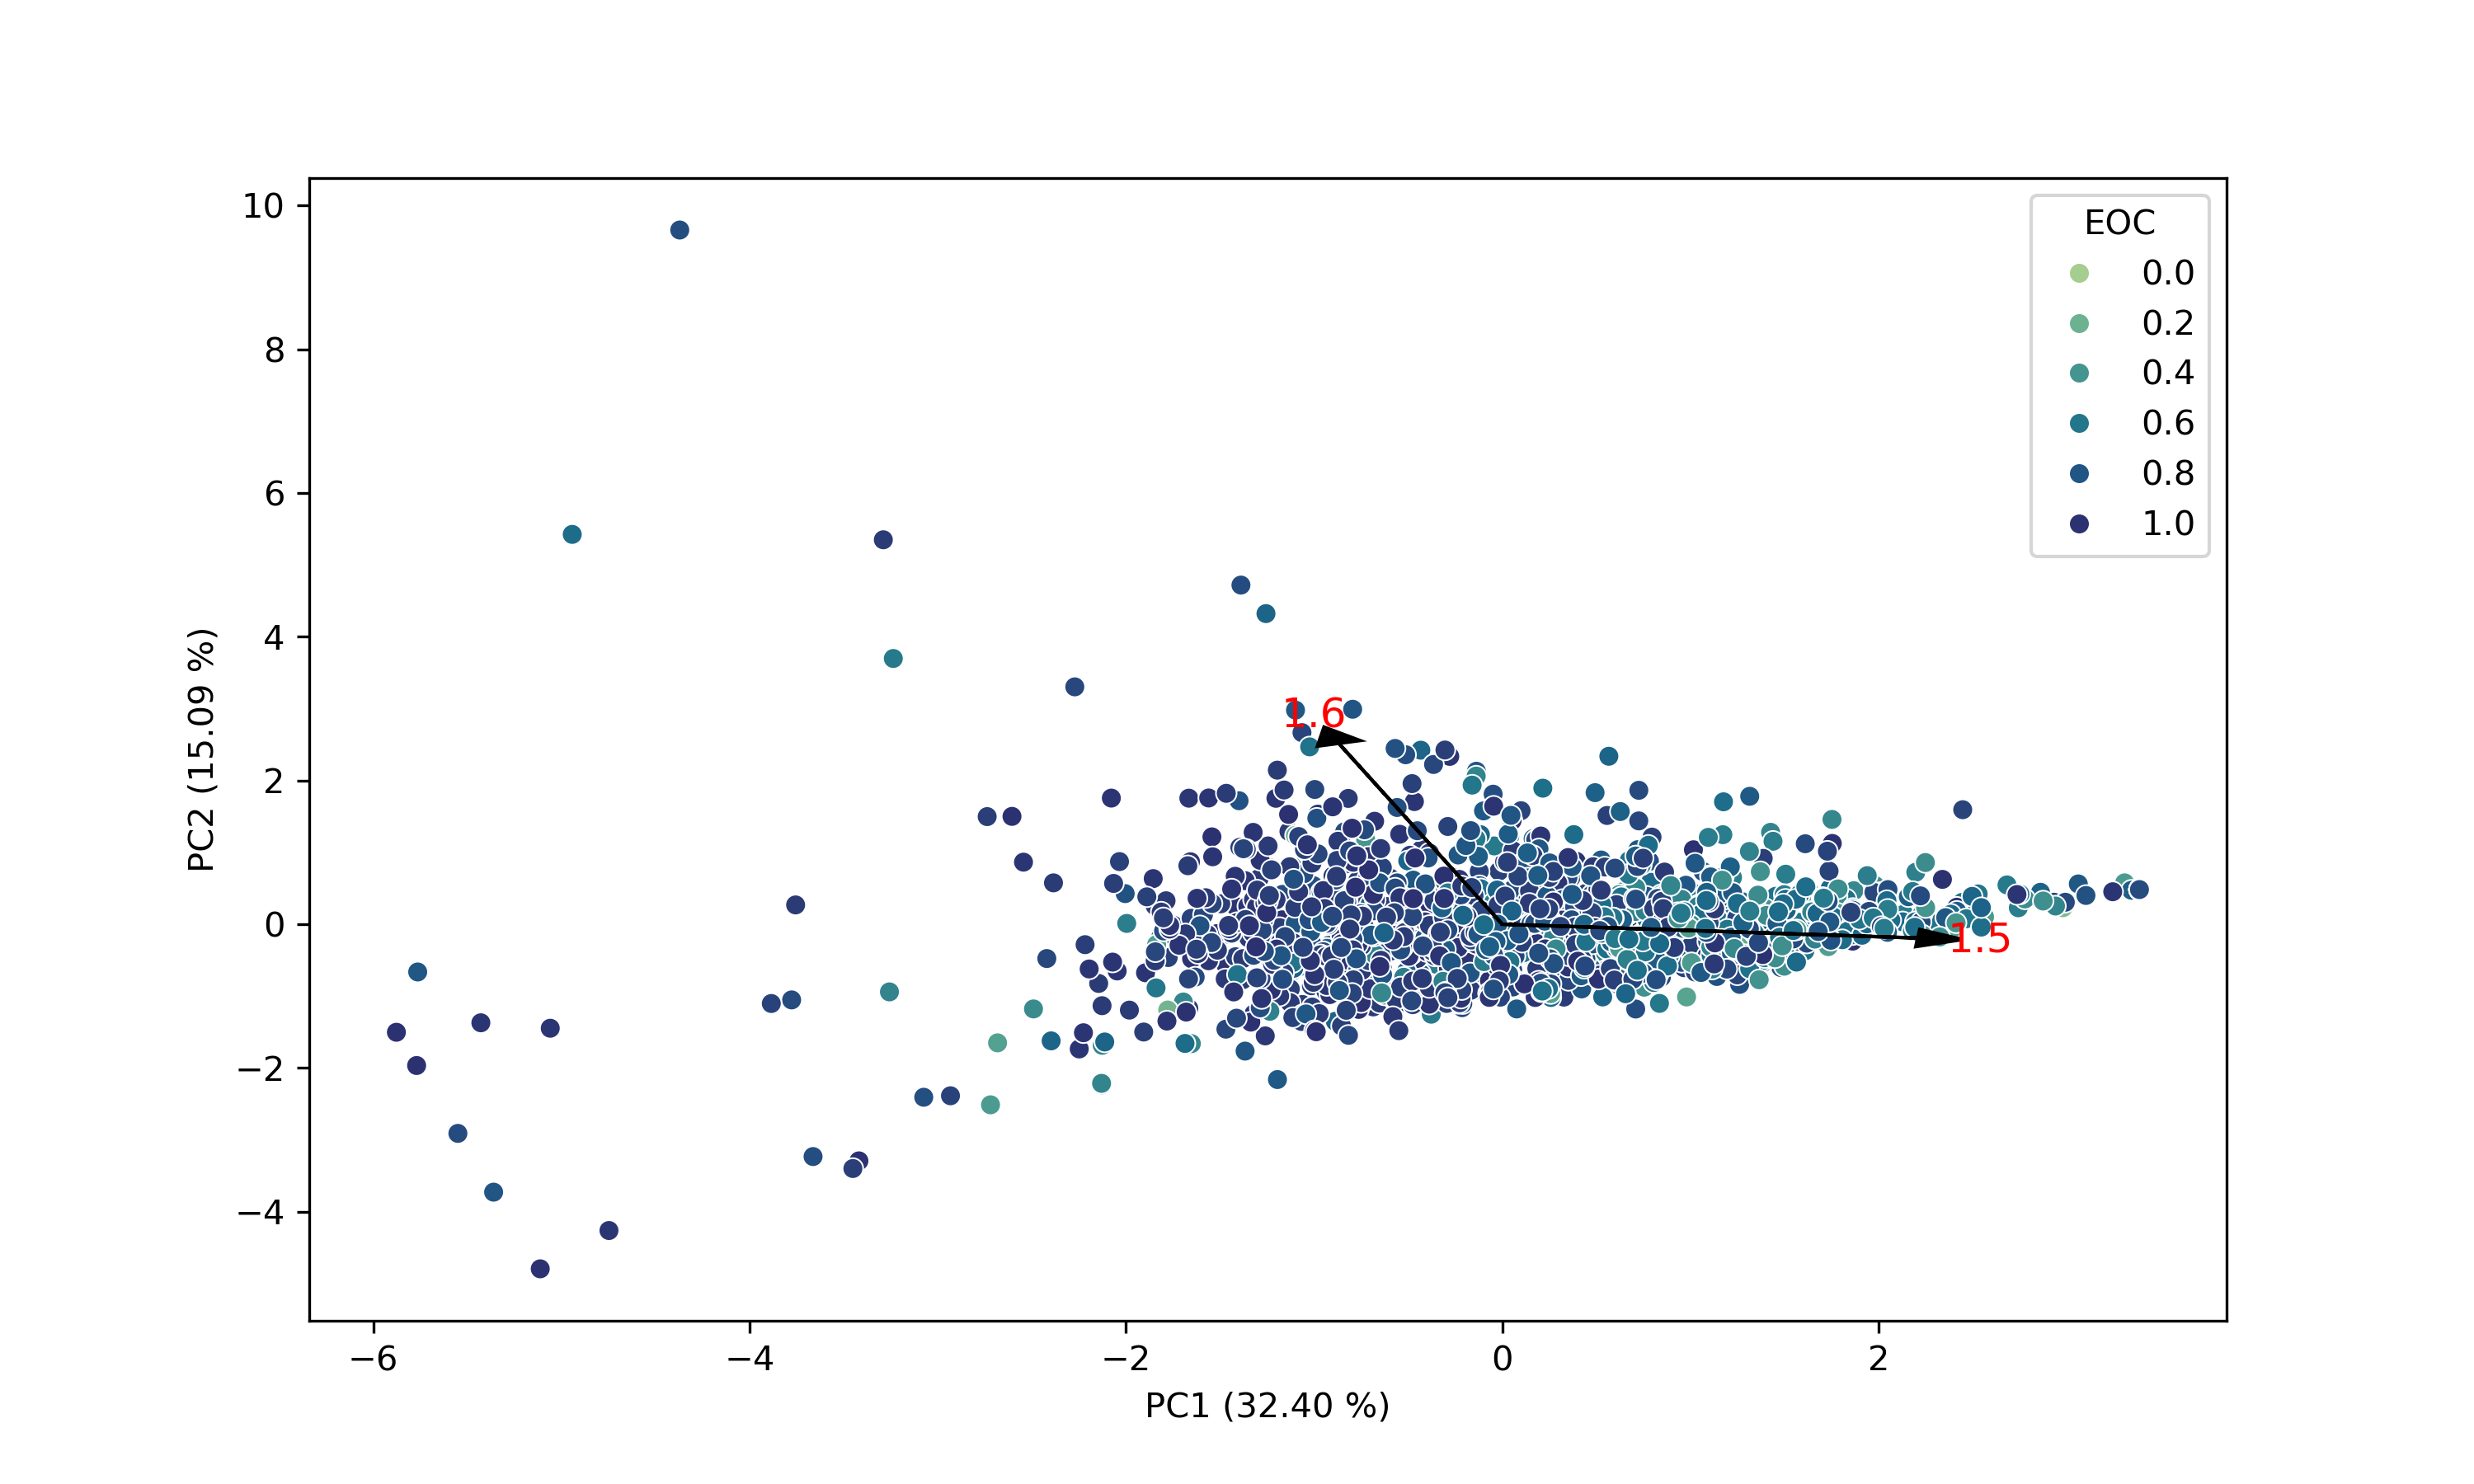
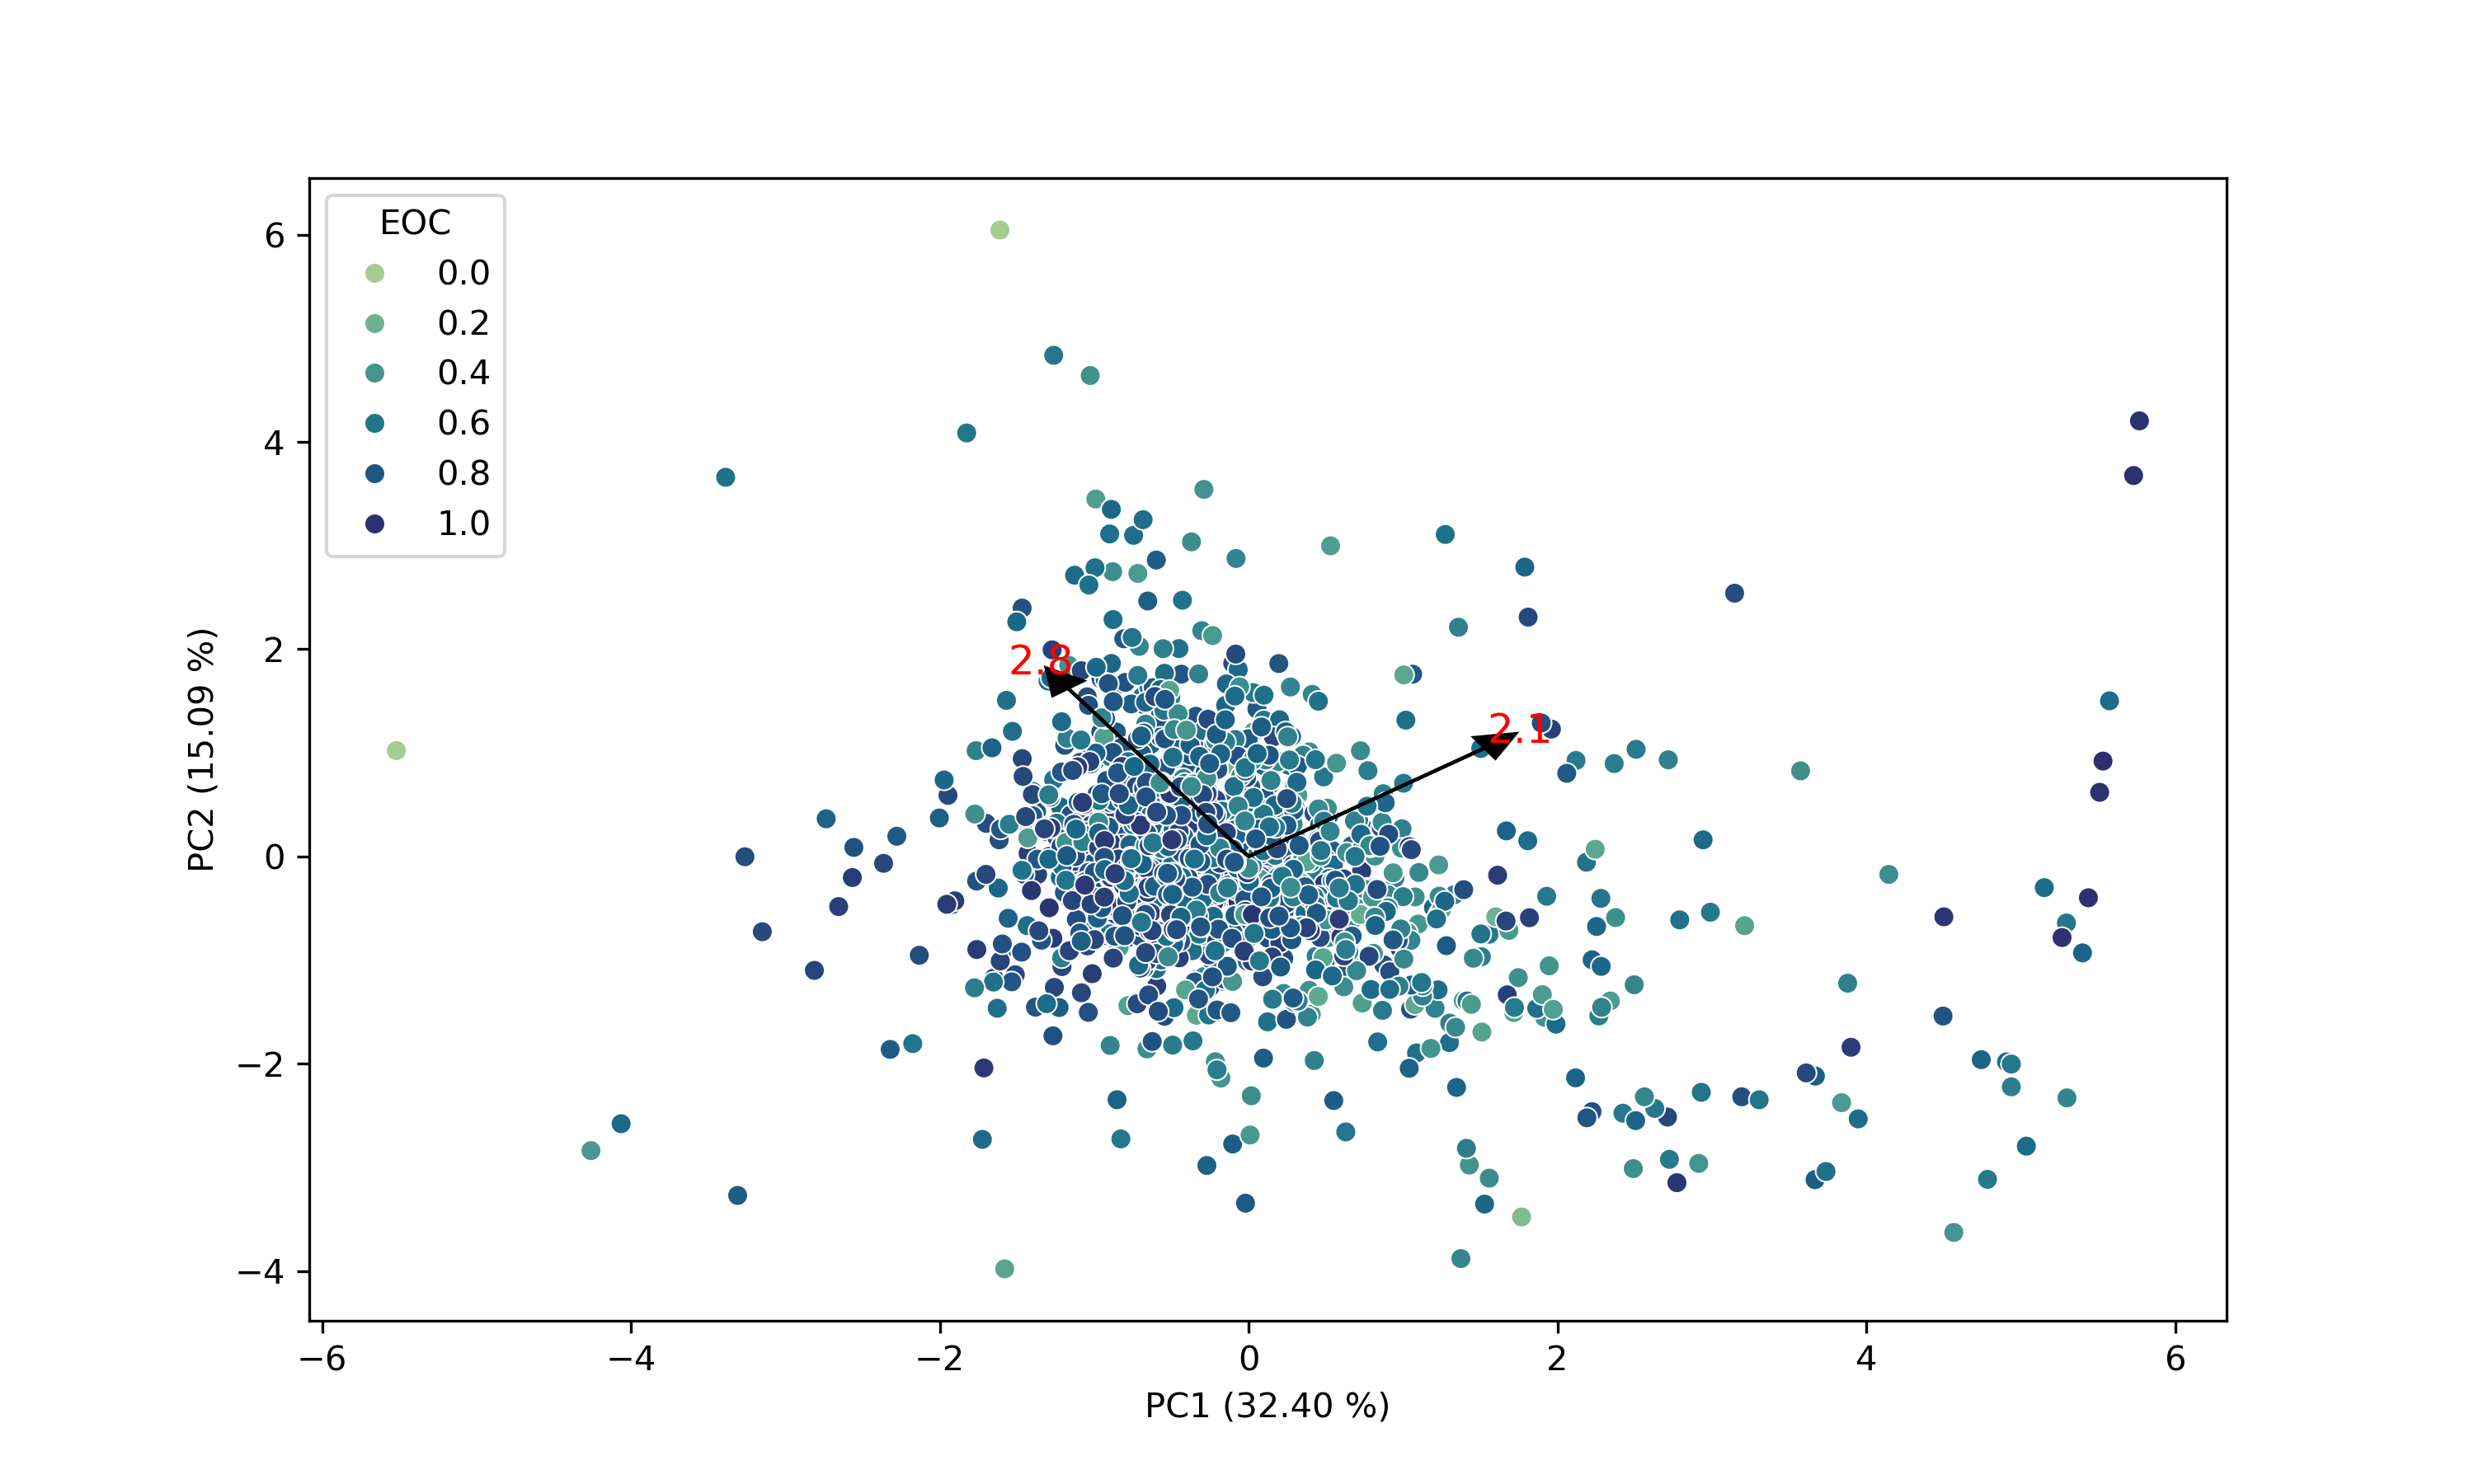
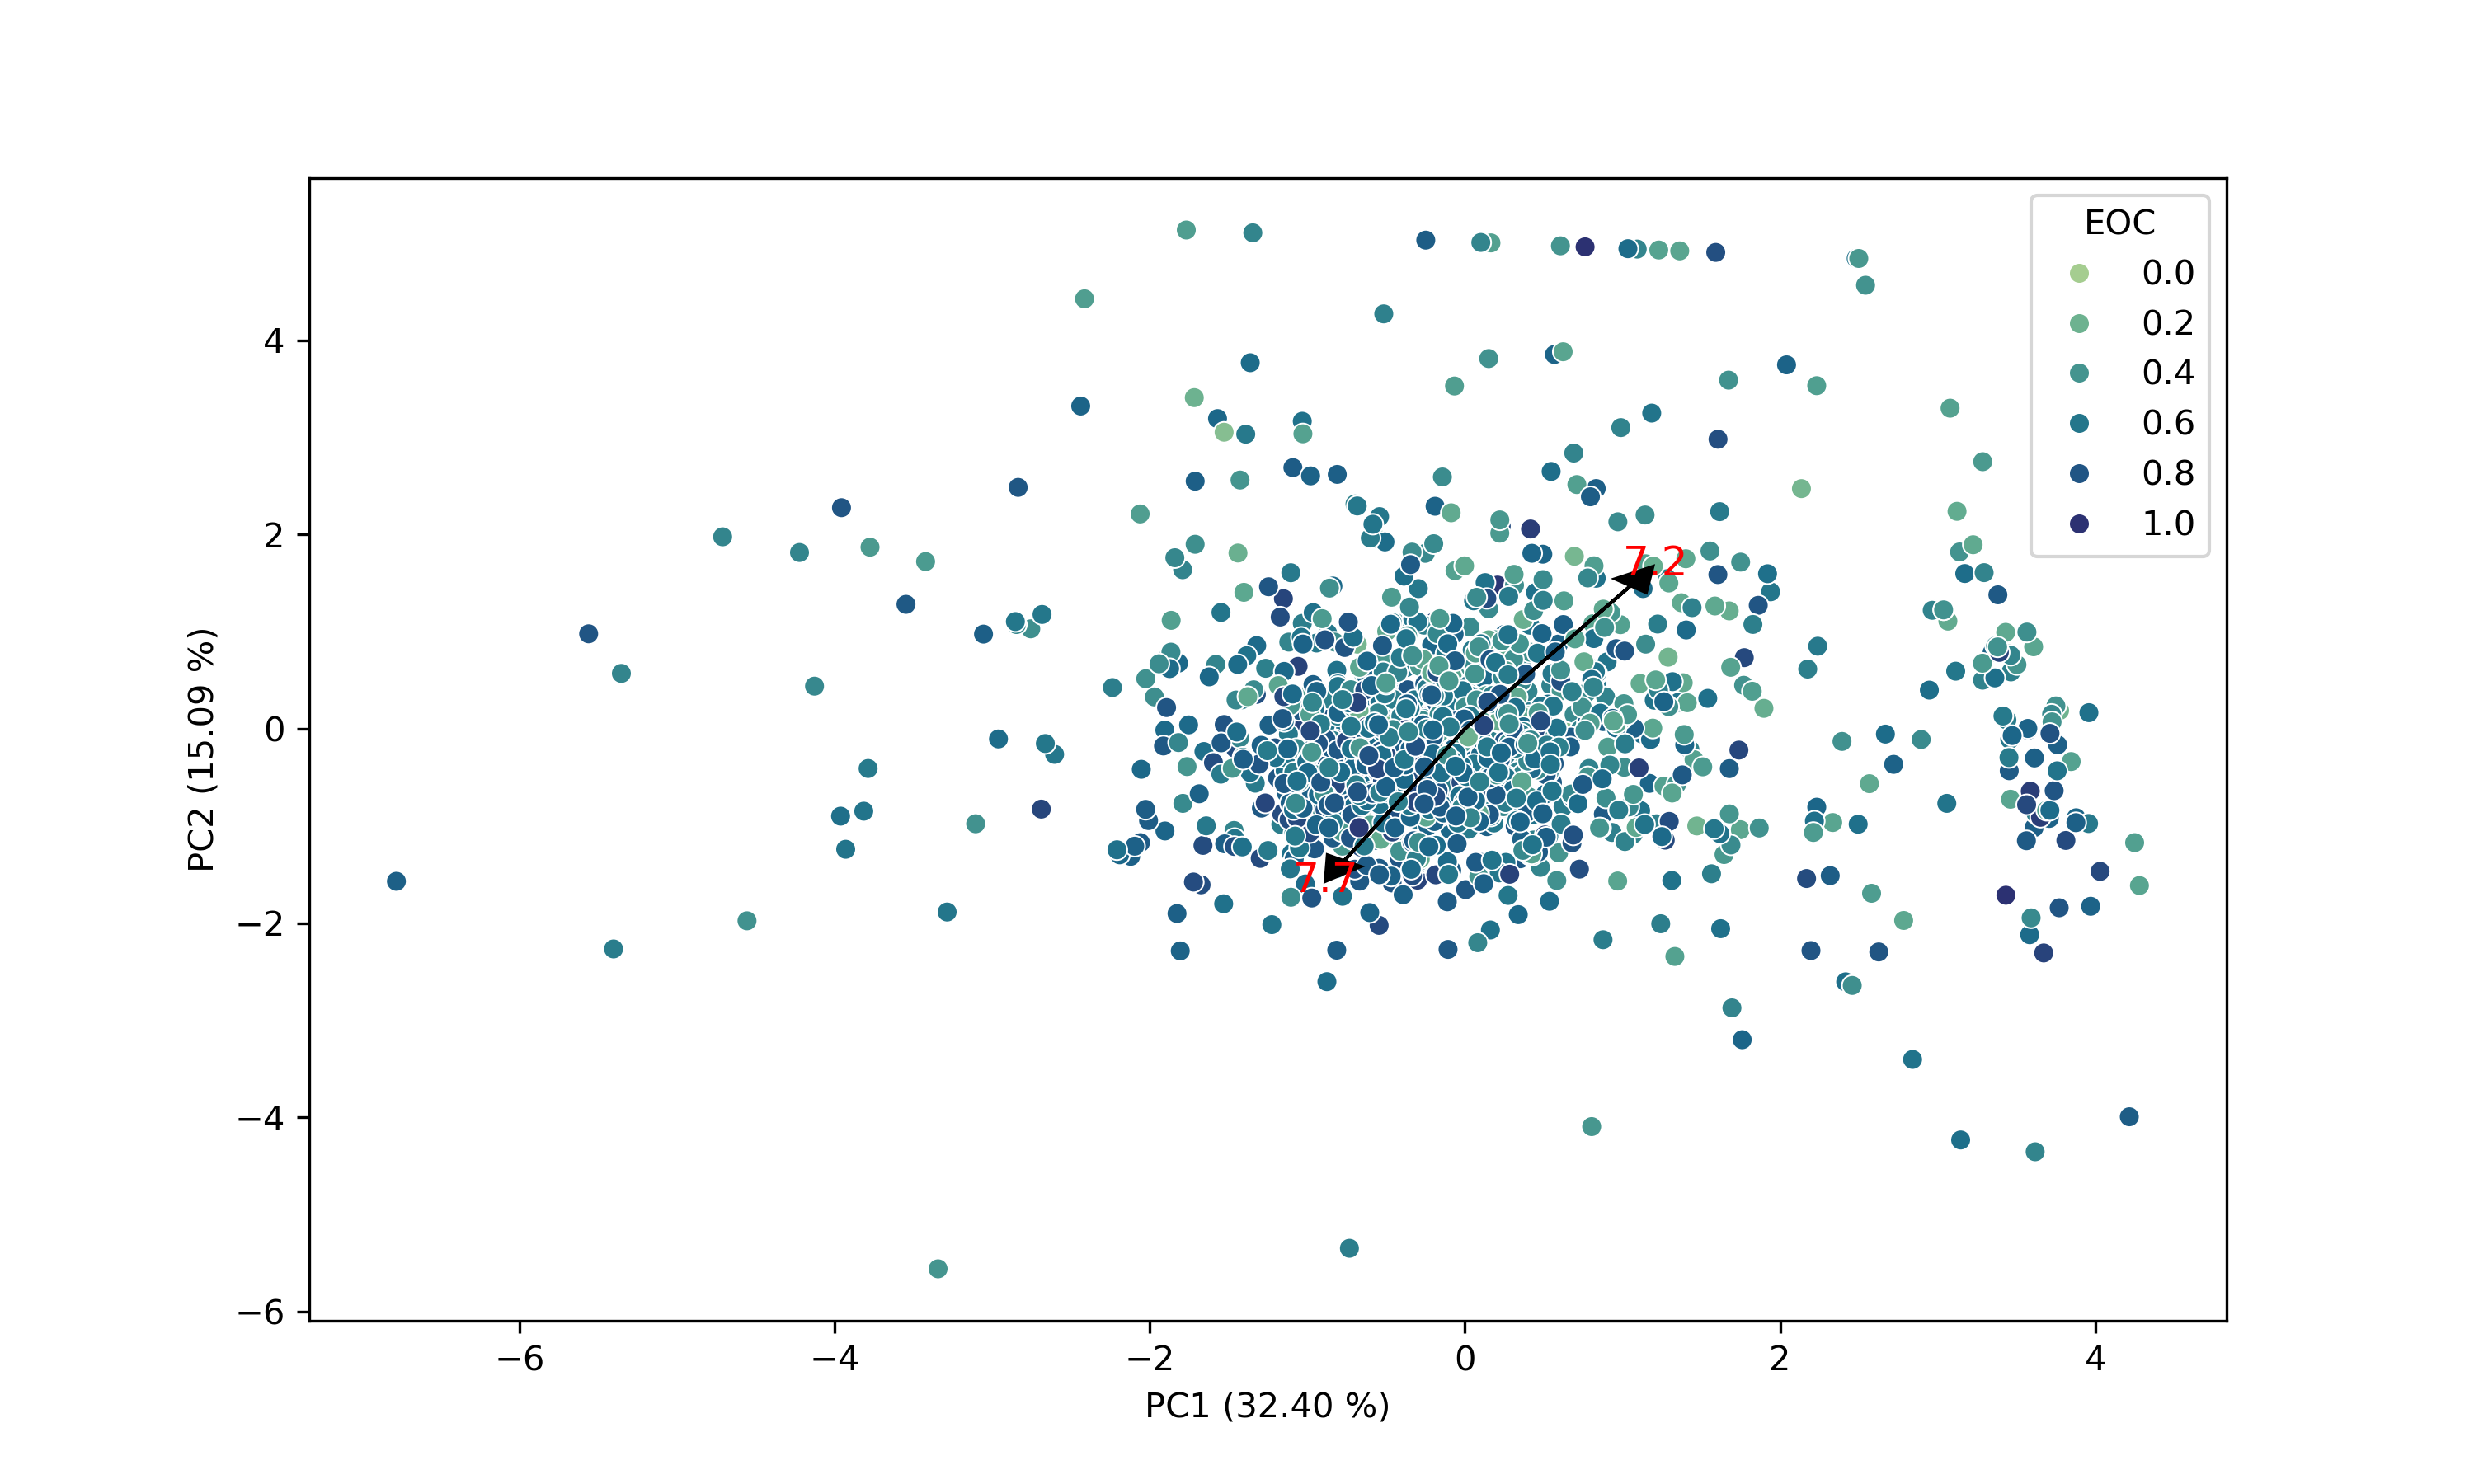
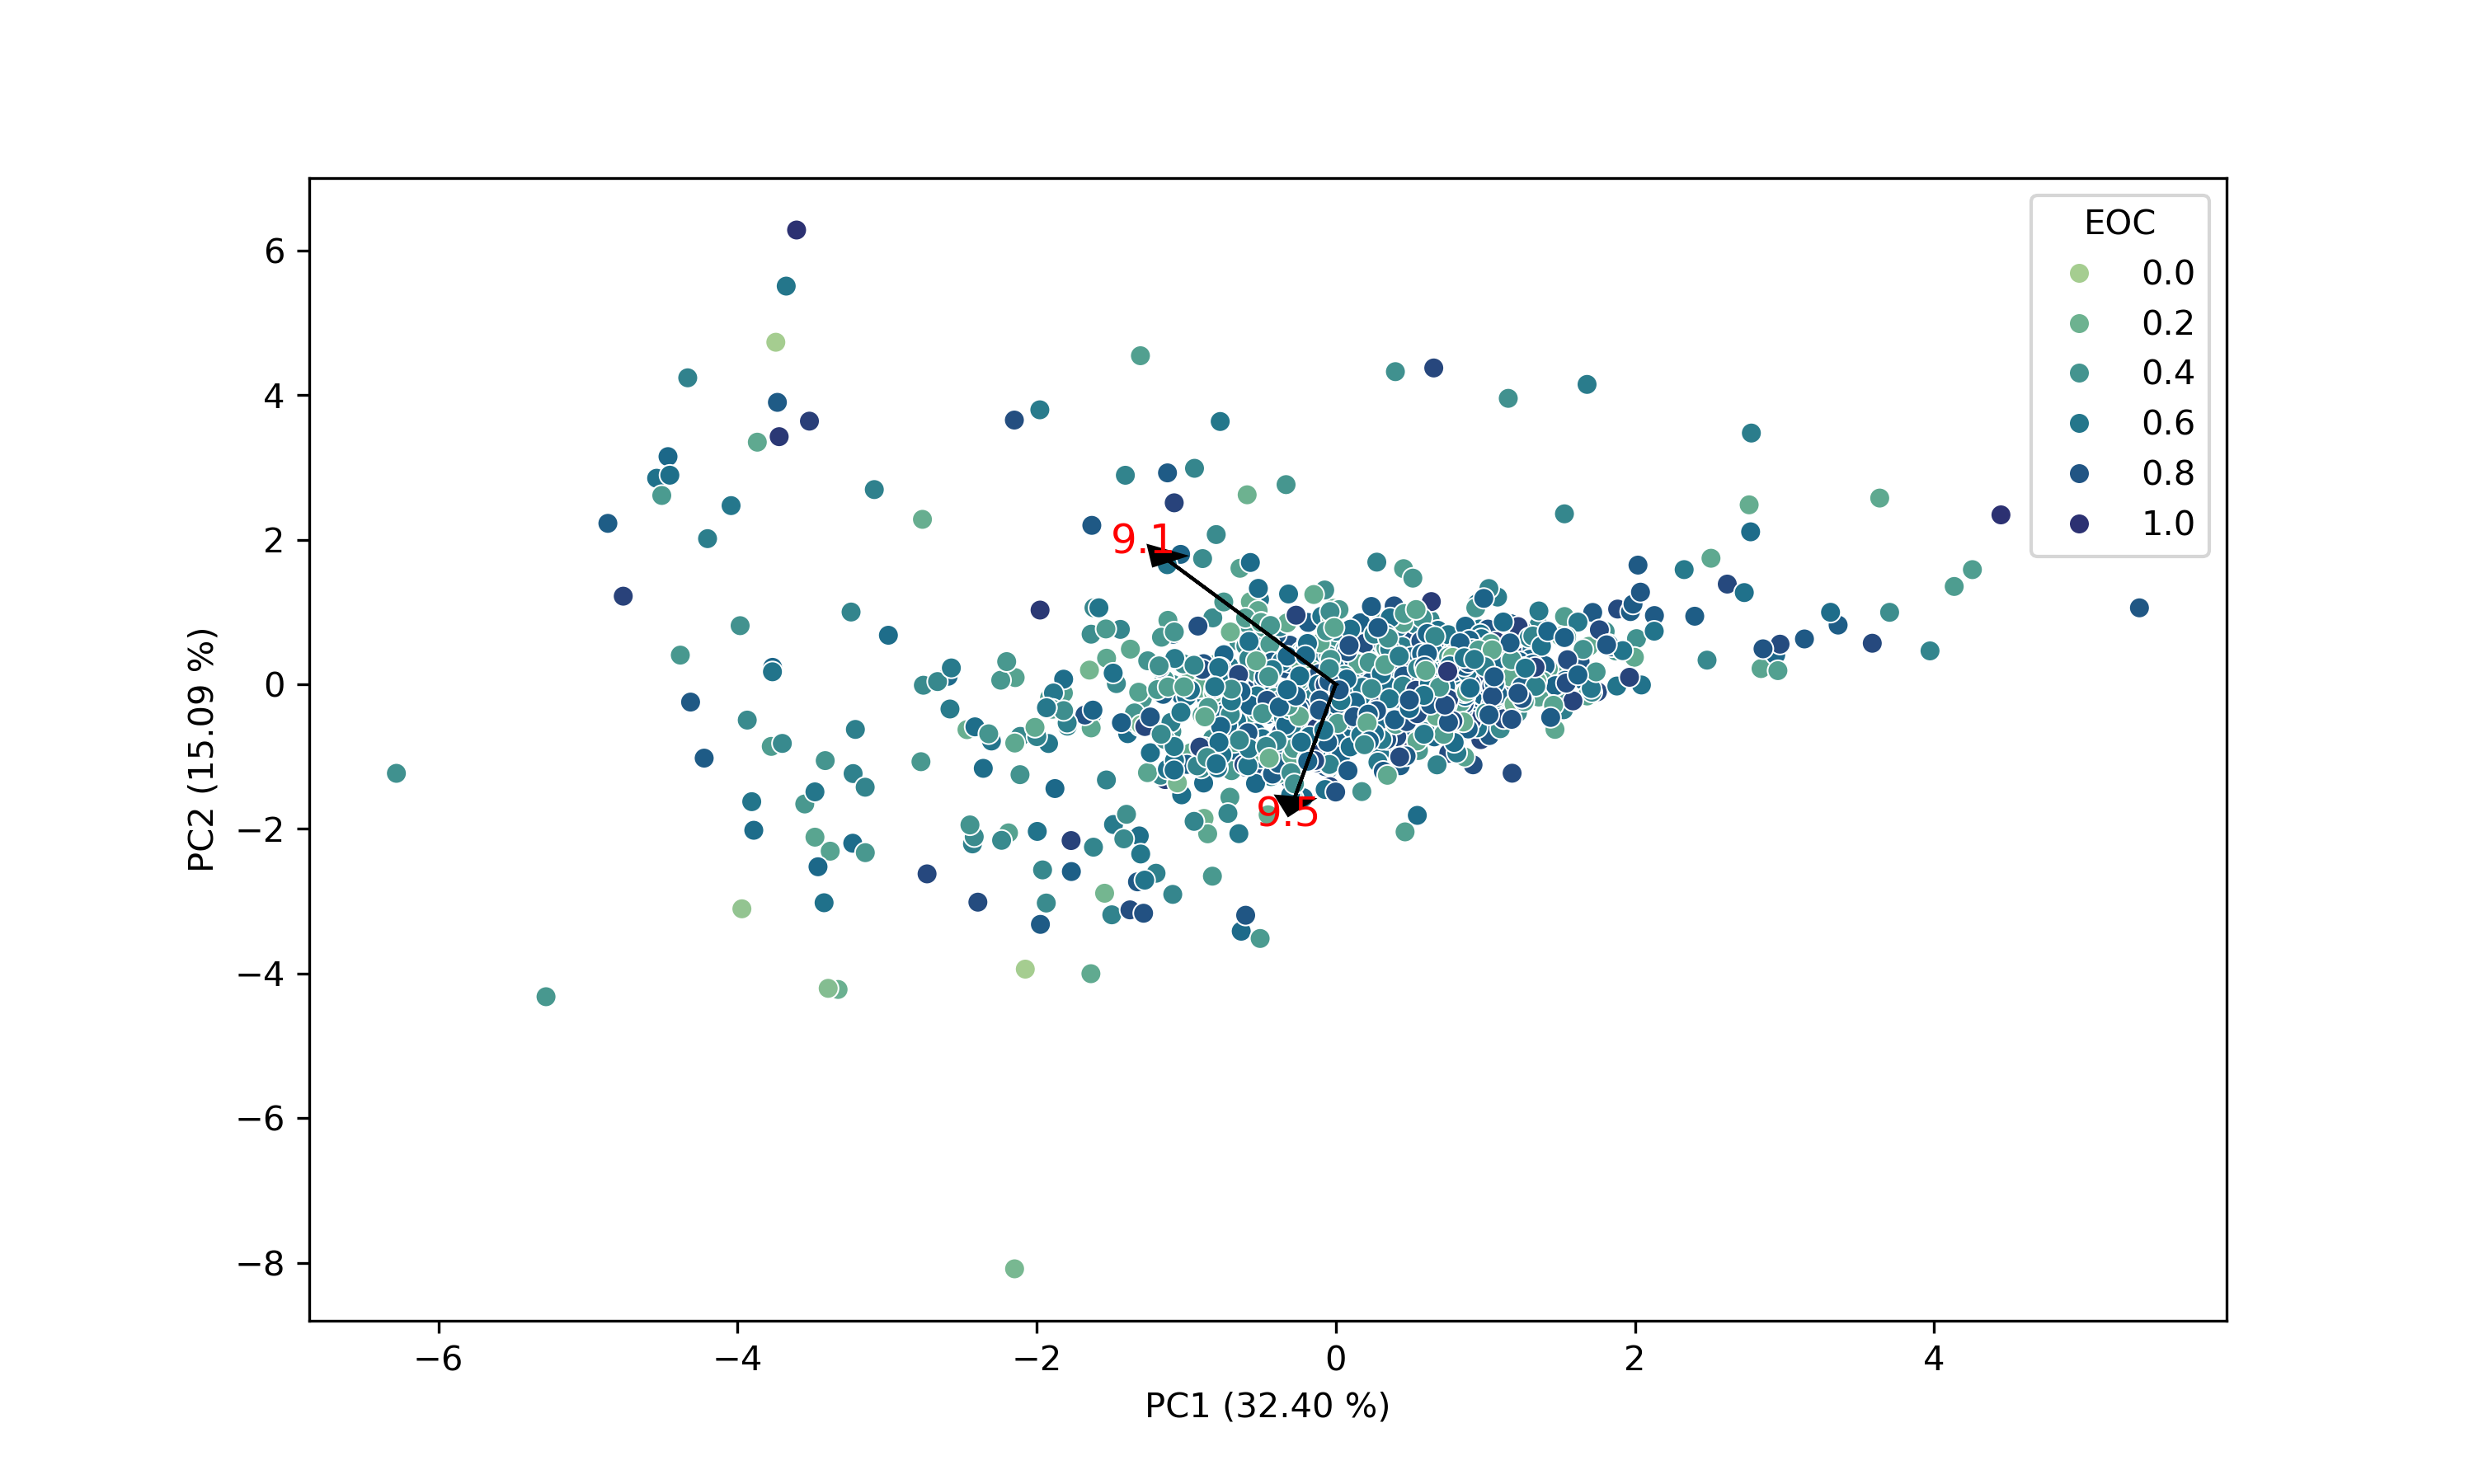
PCA Dimension Reduction
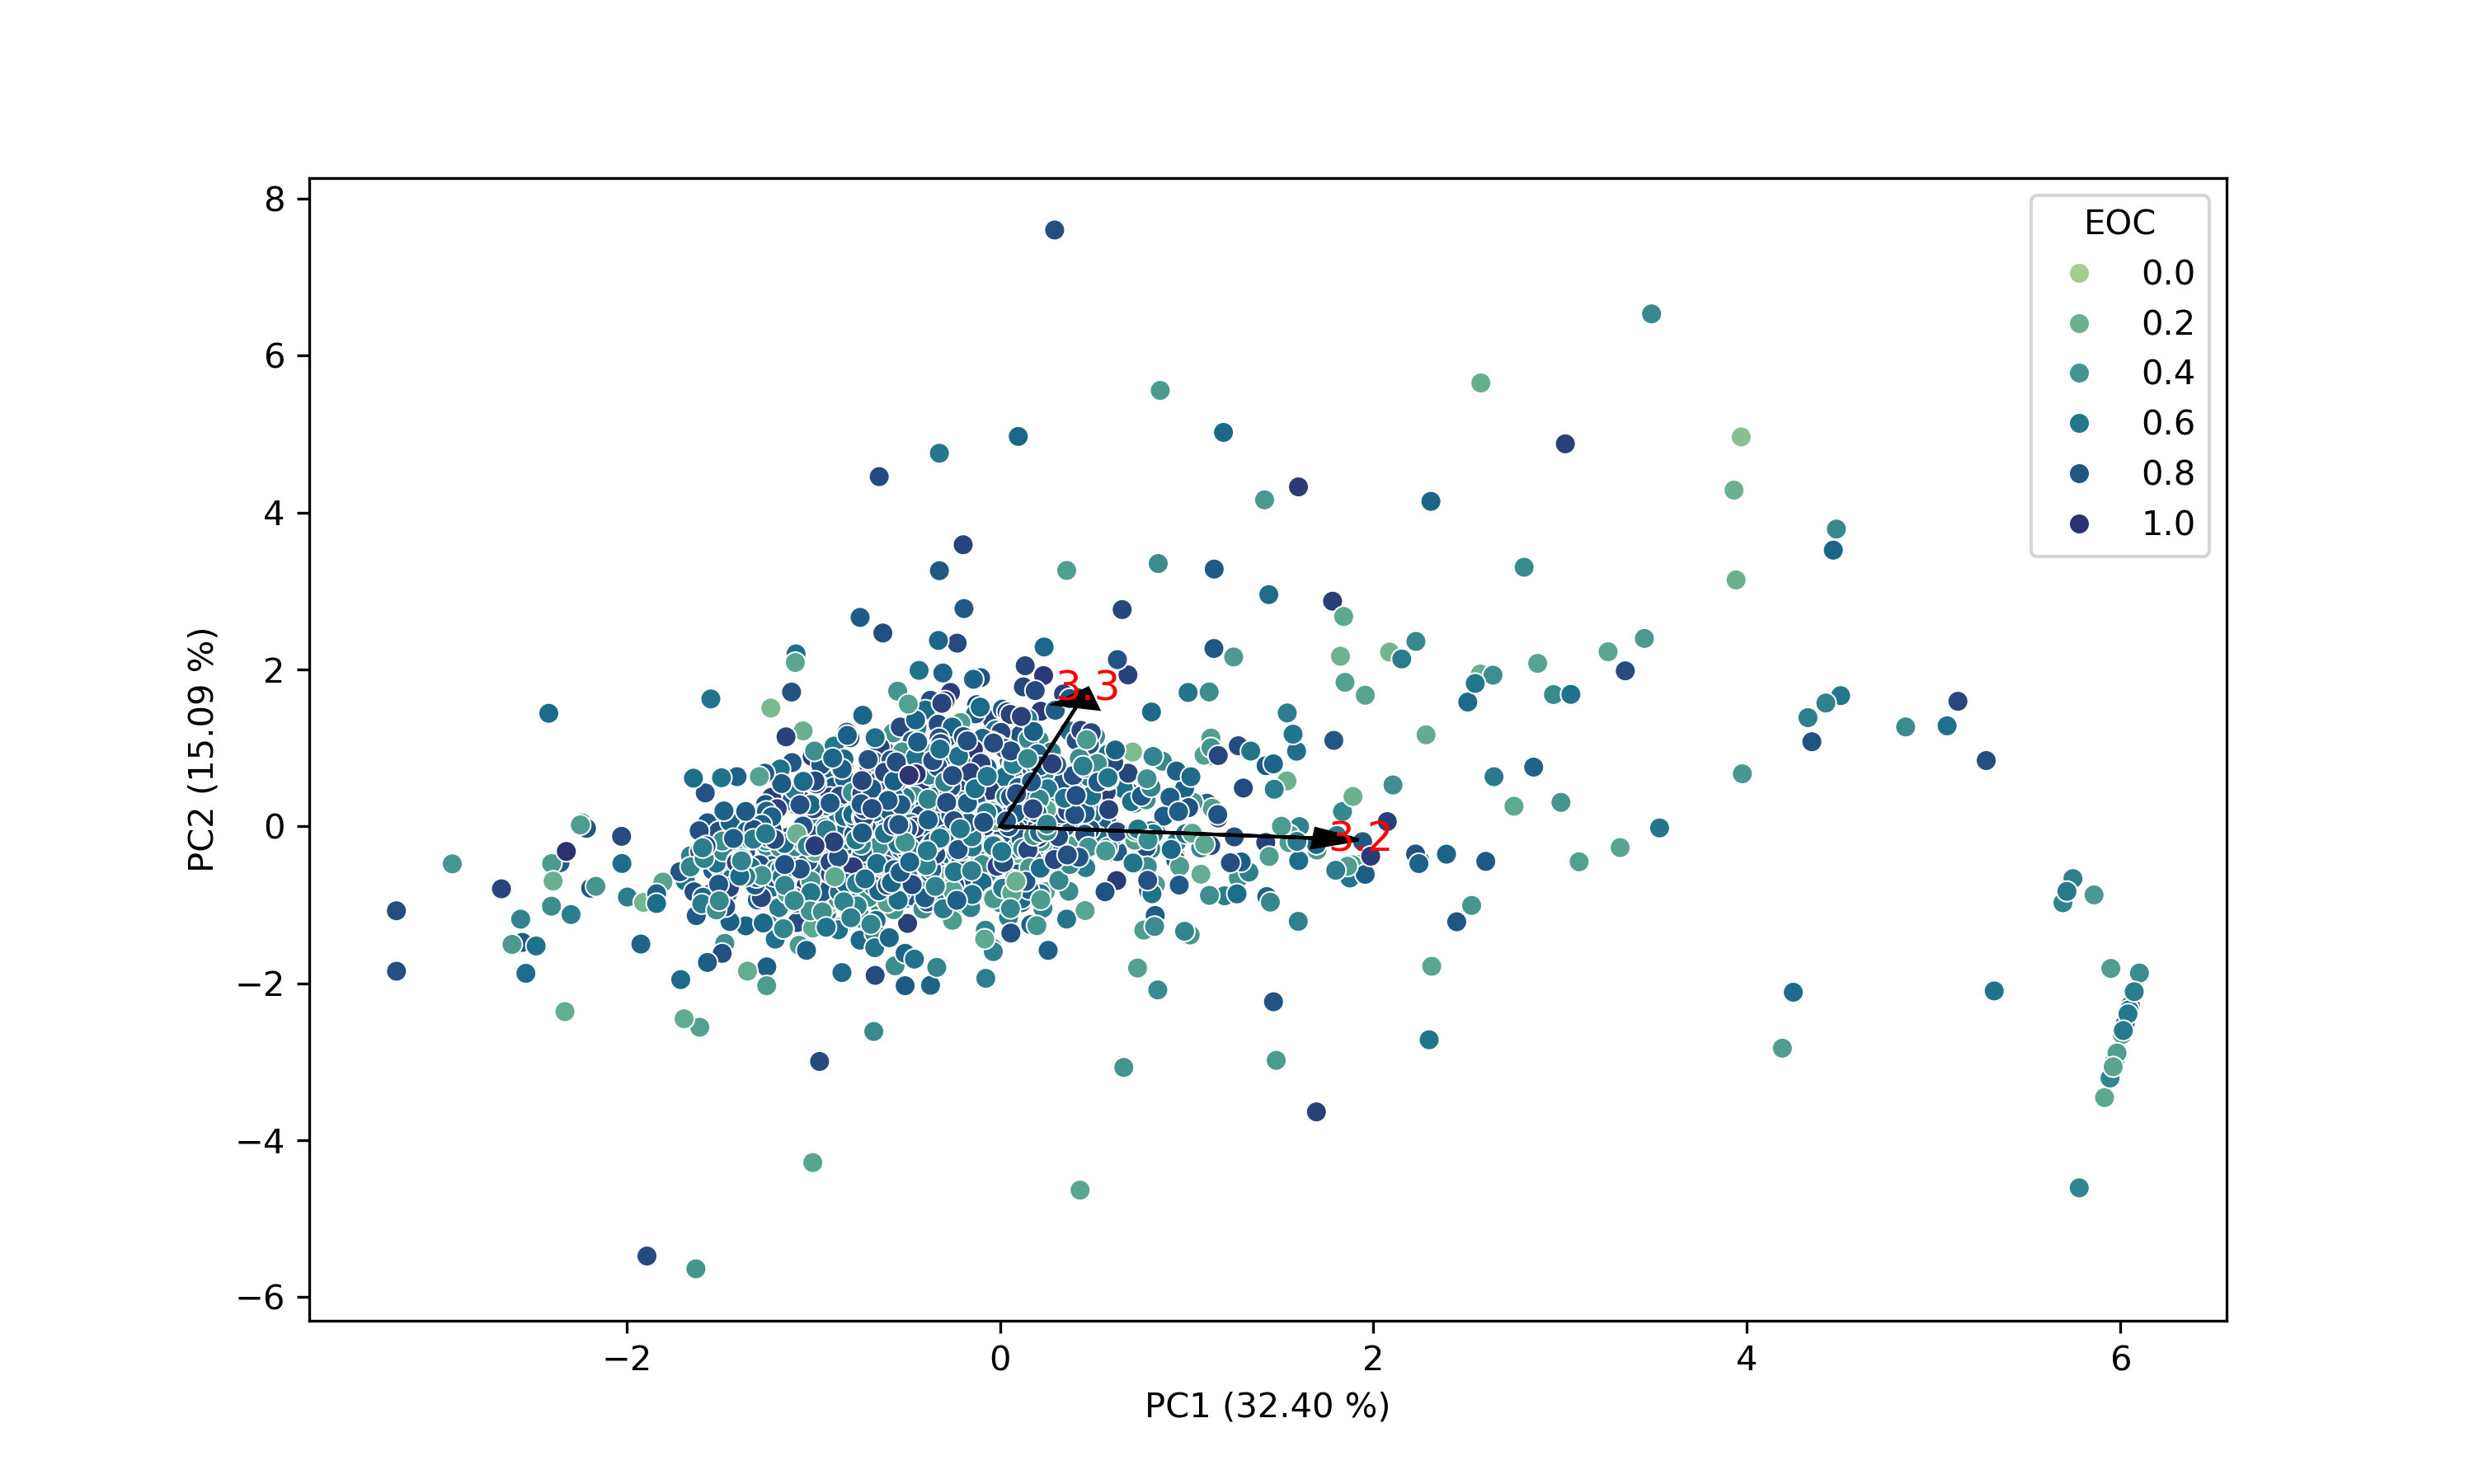
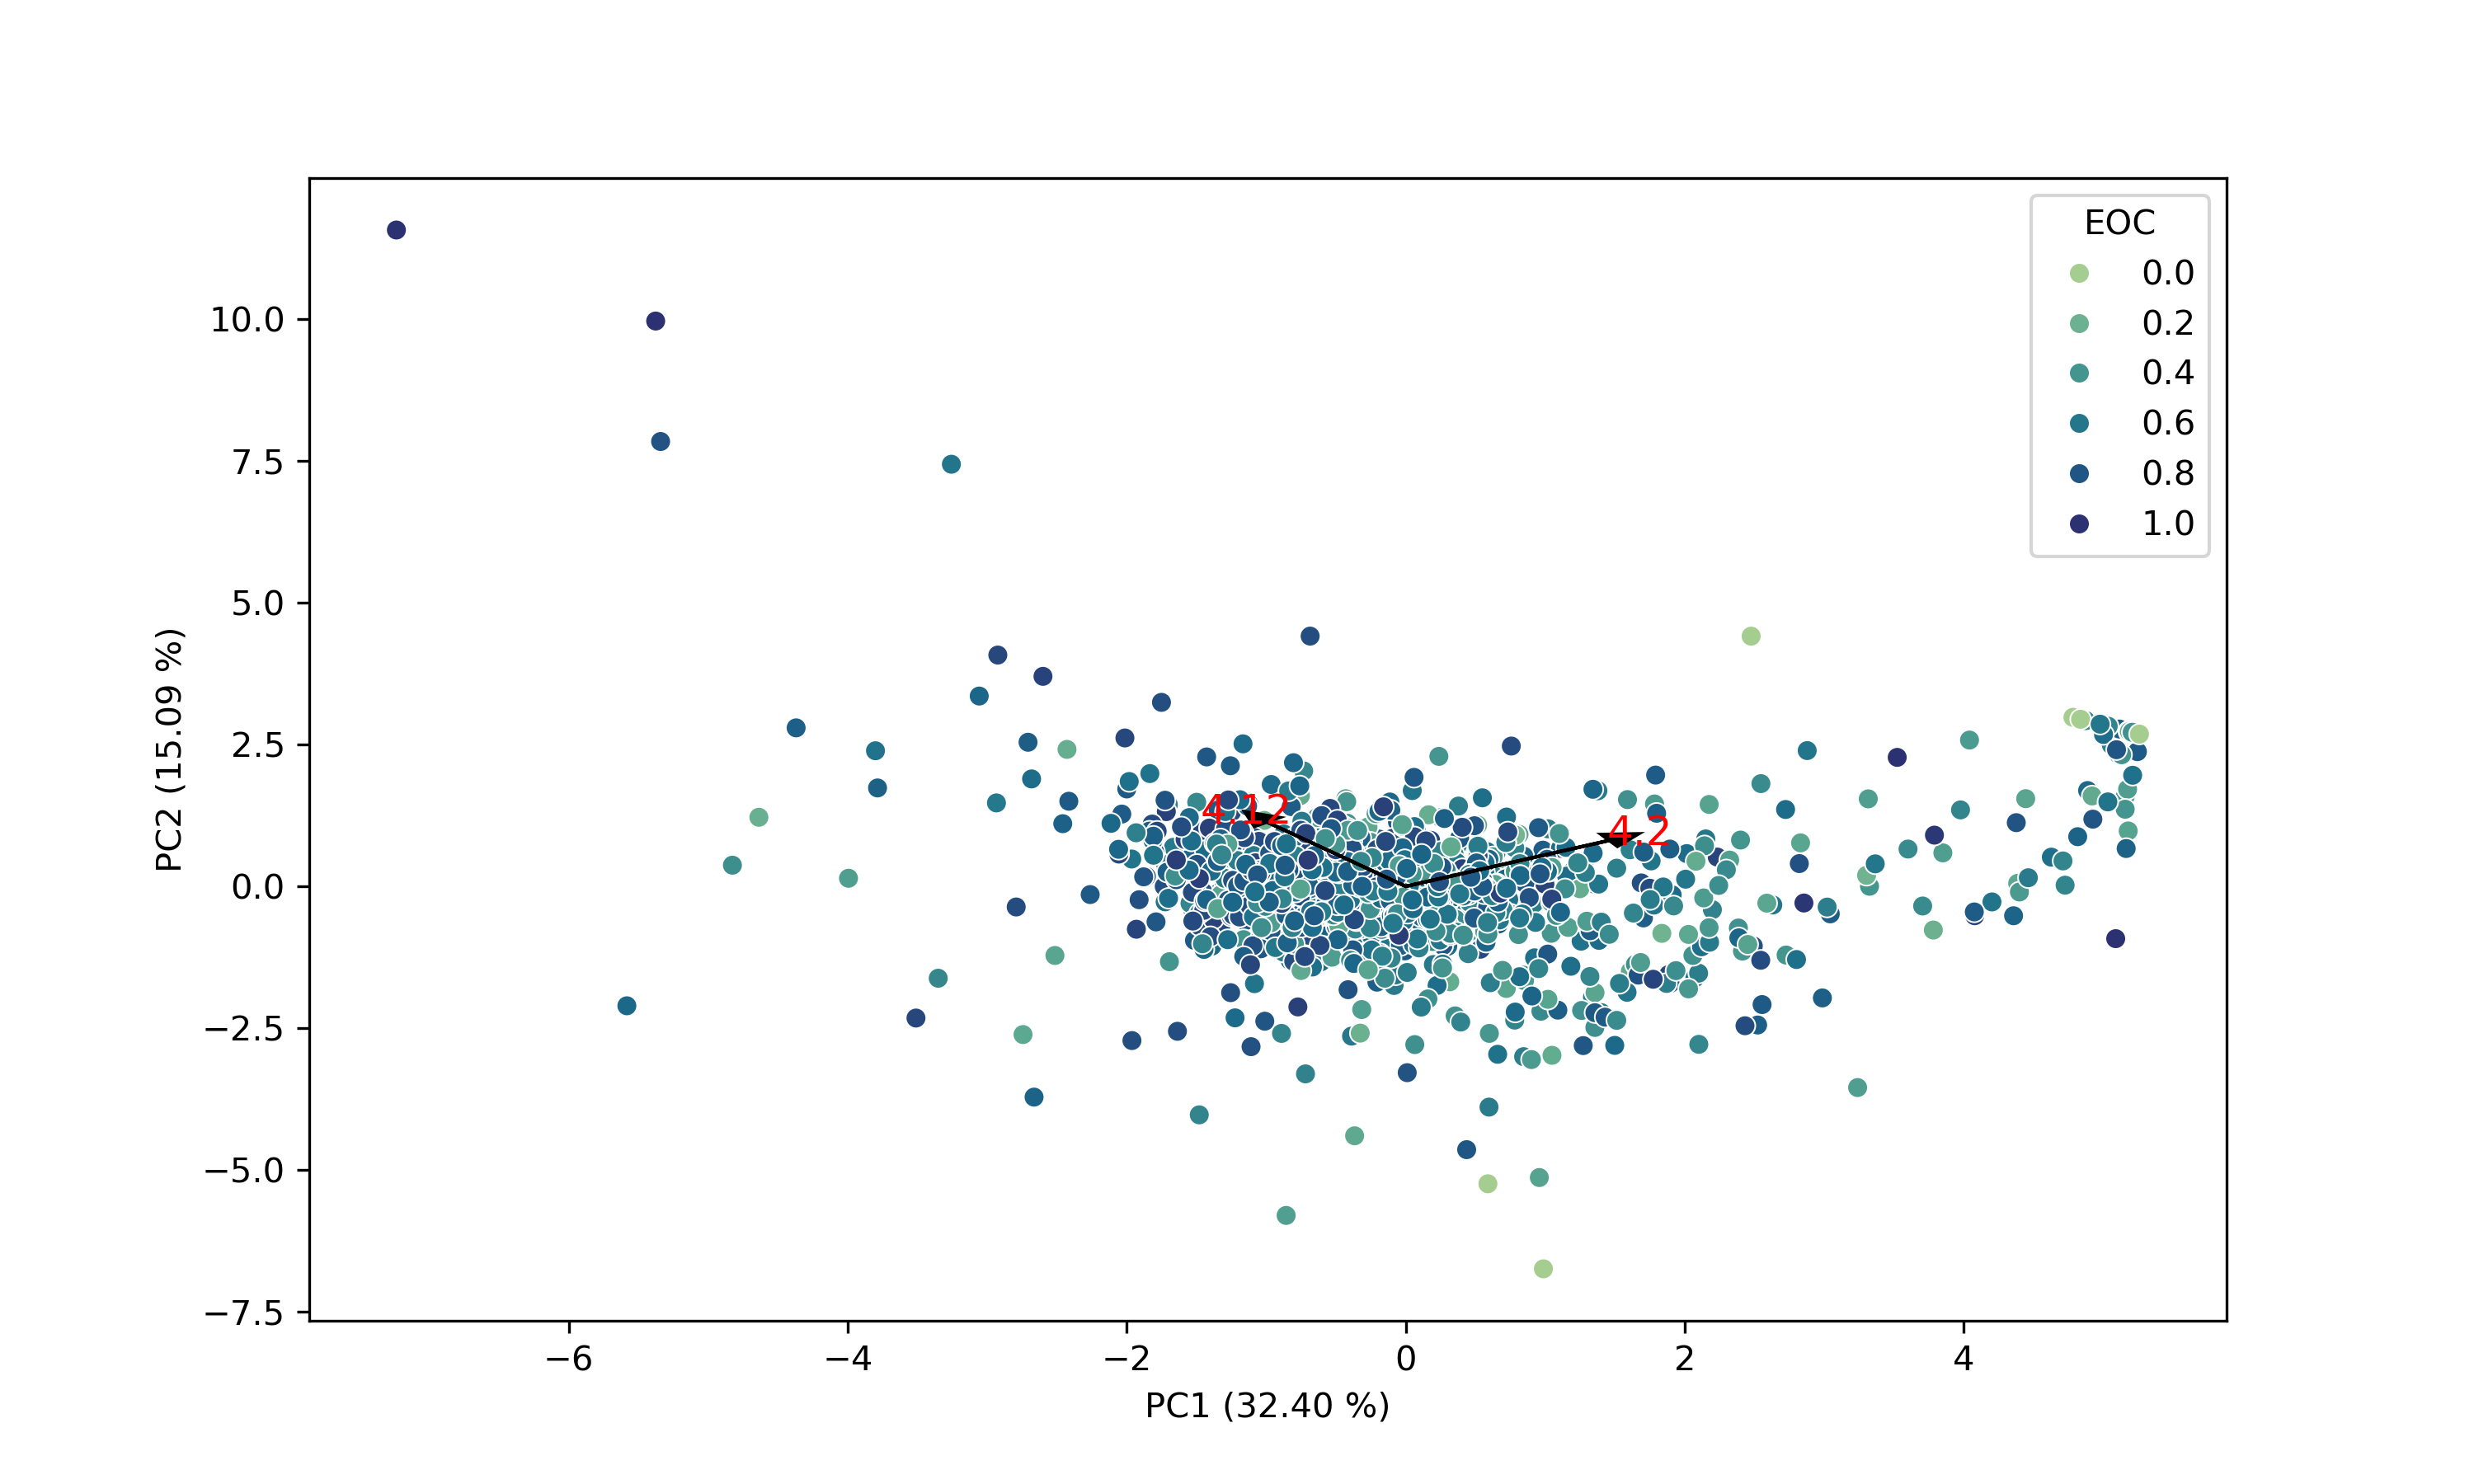
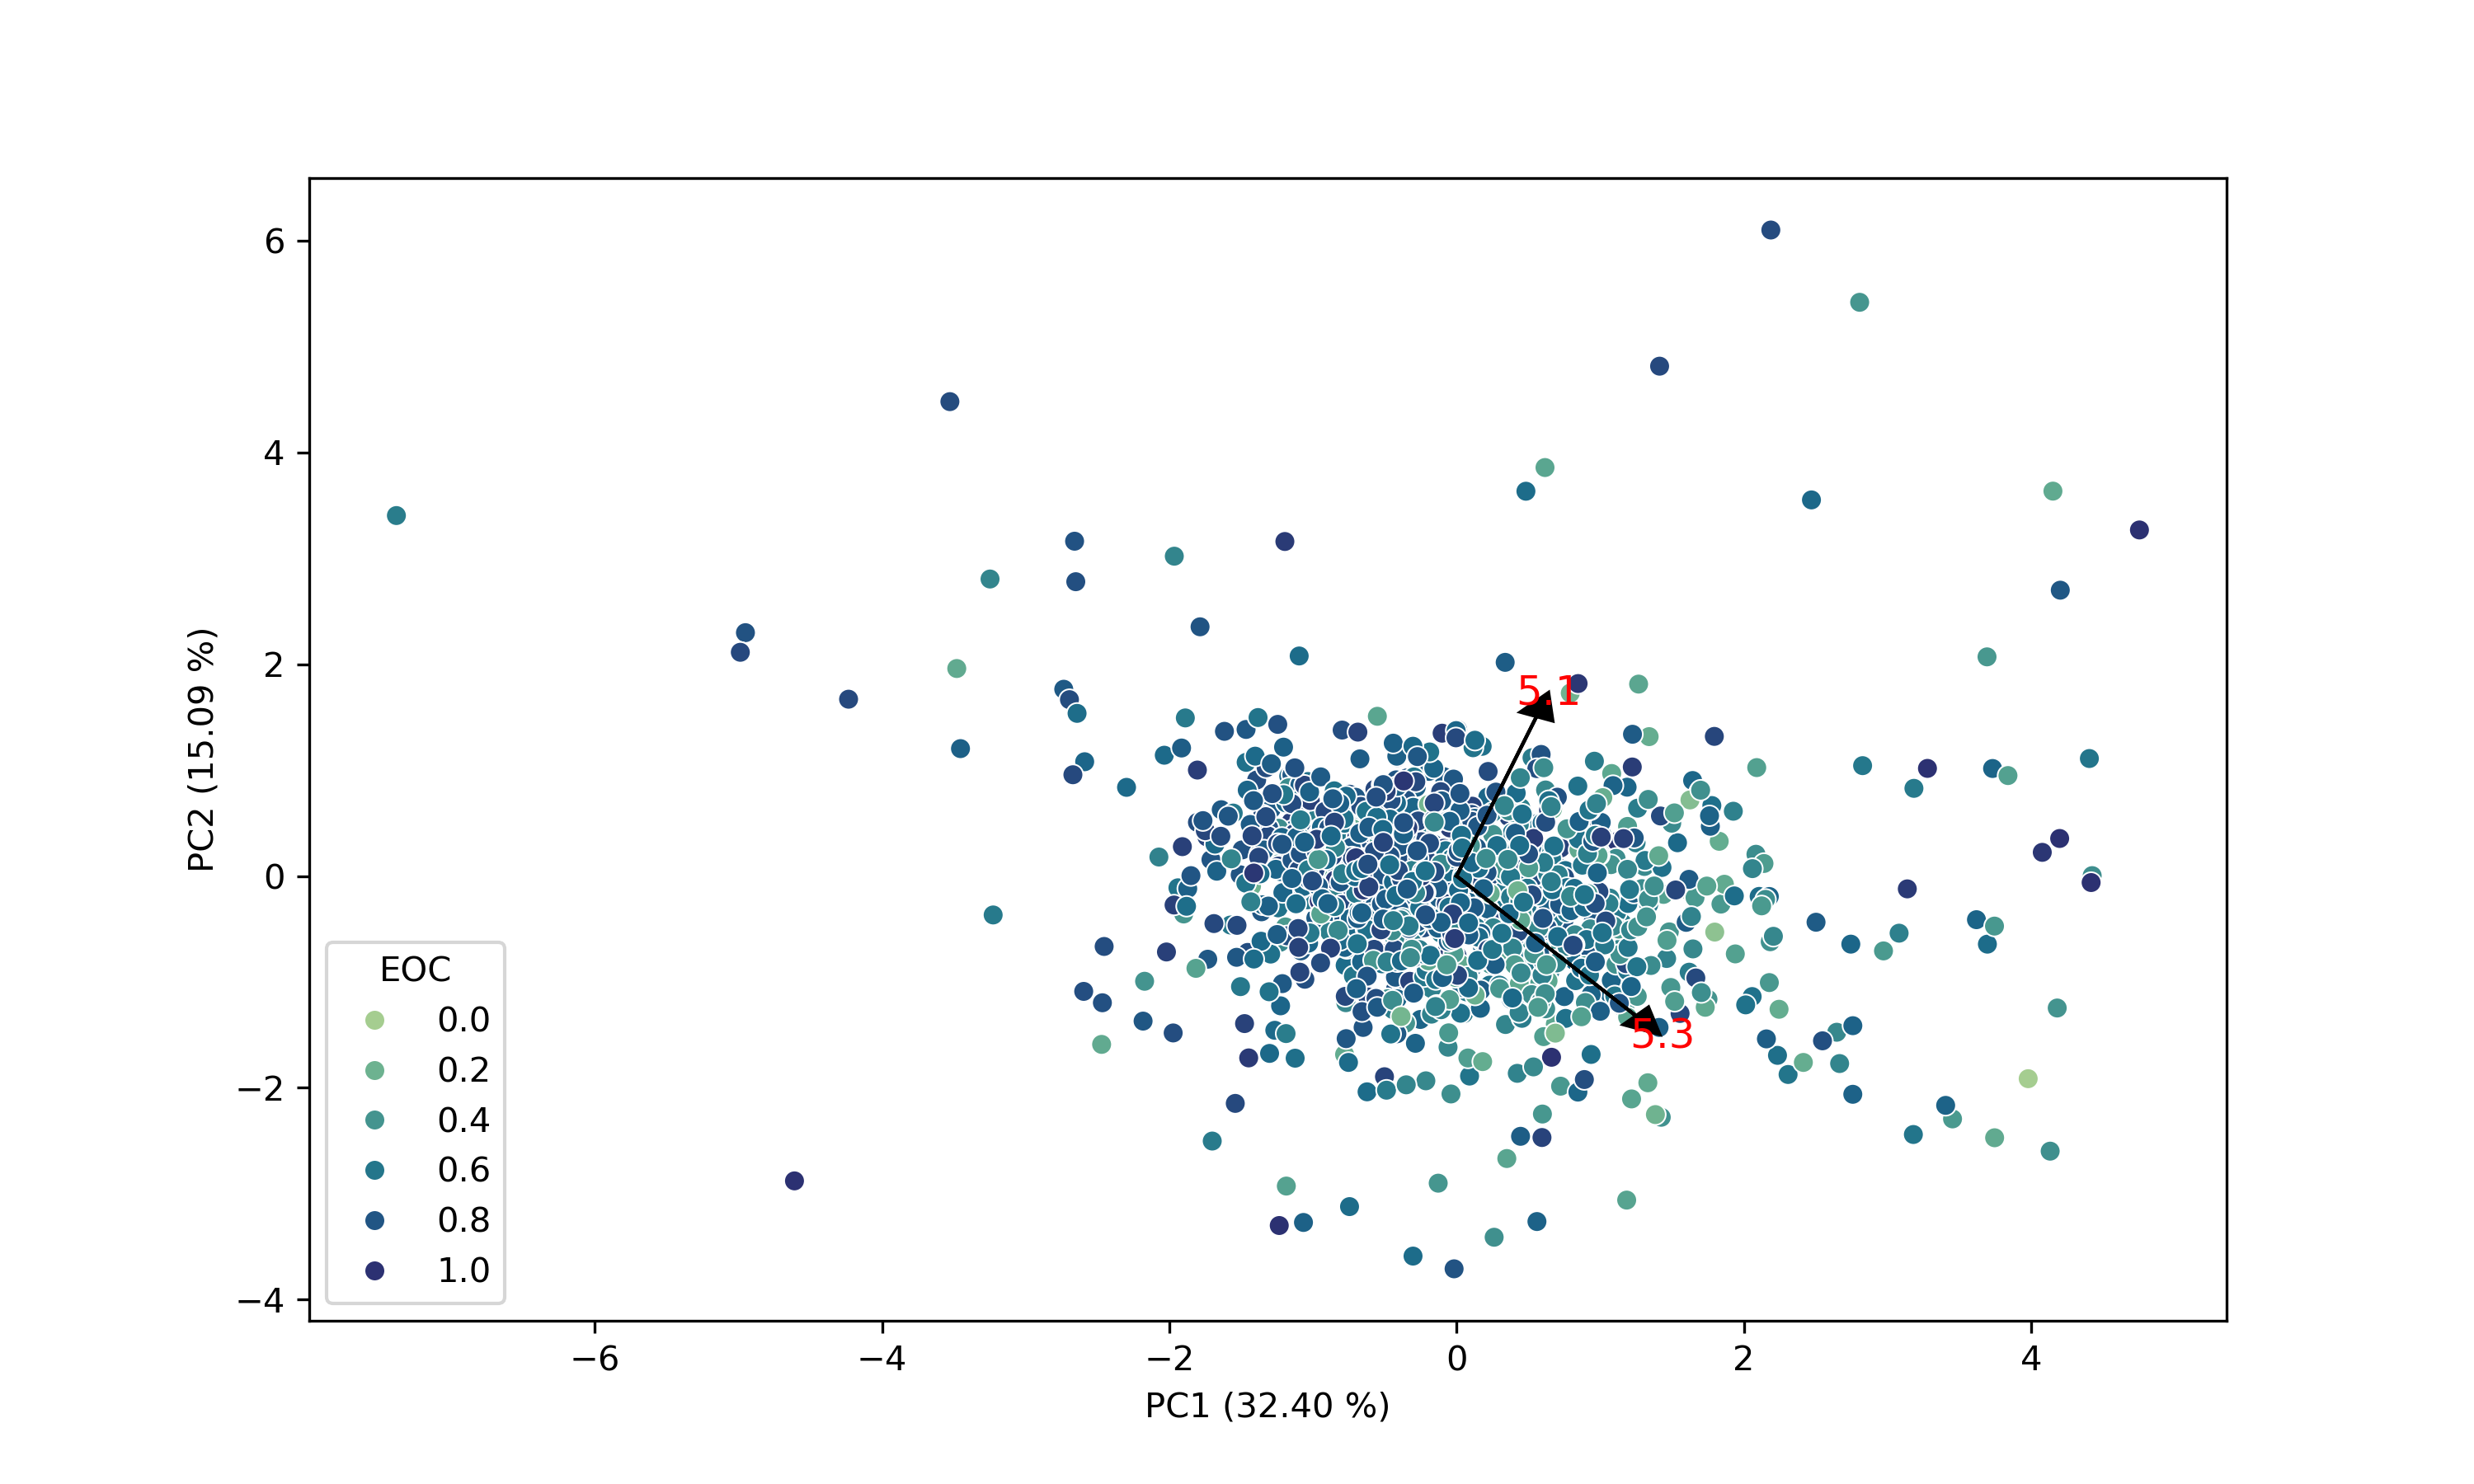
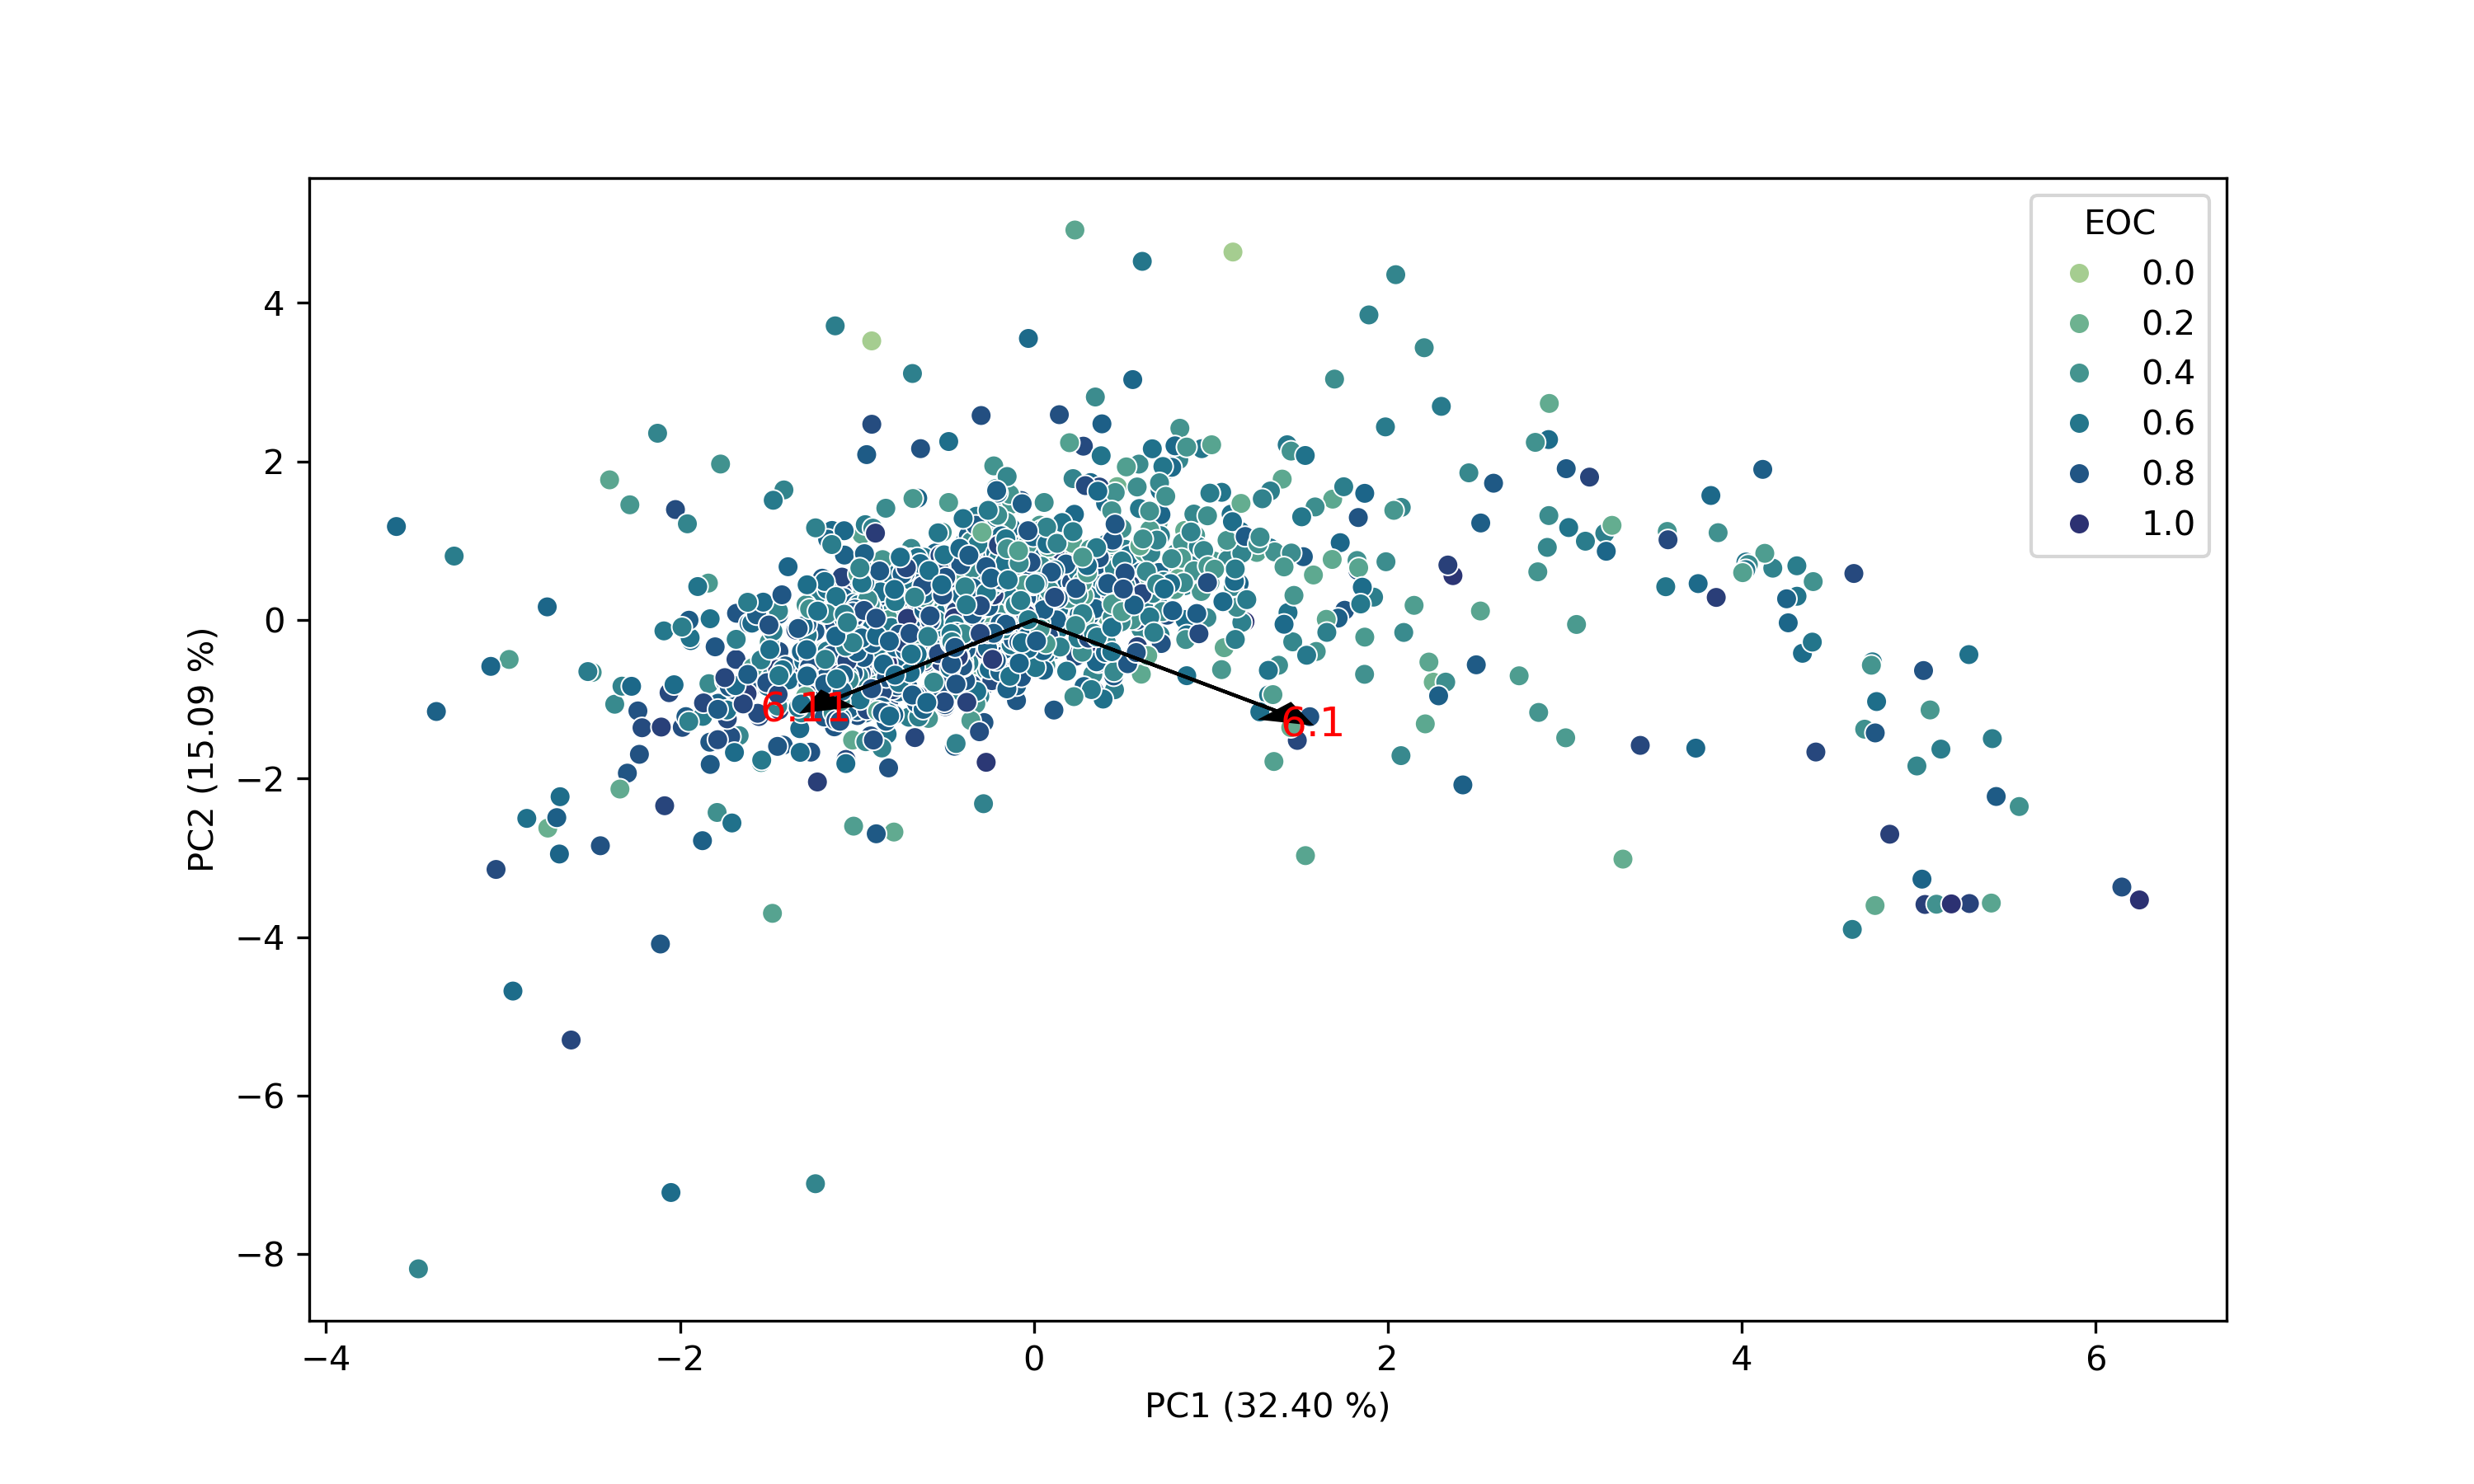
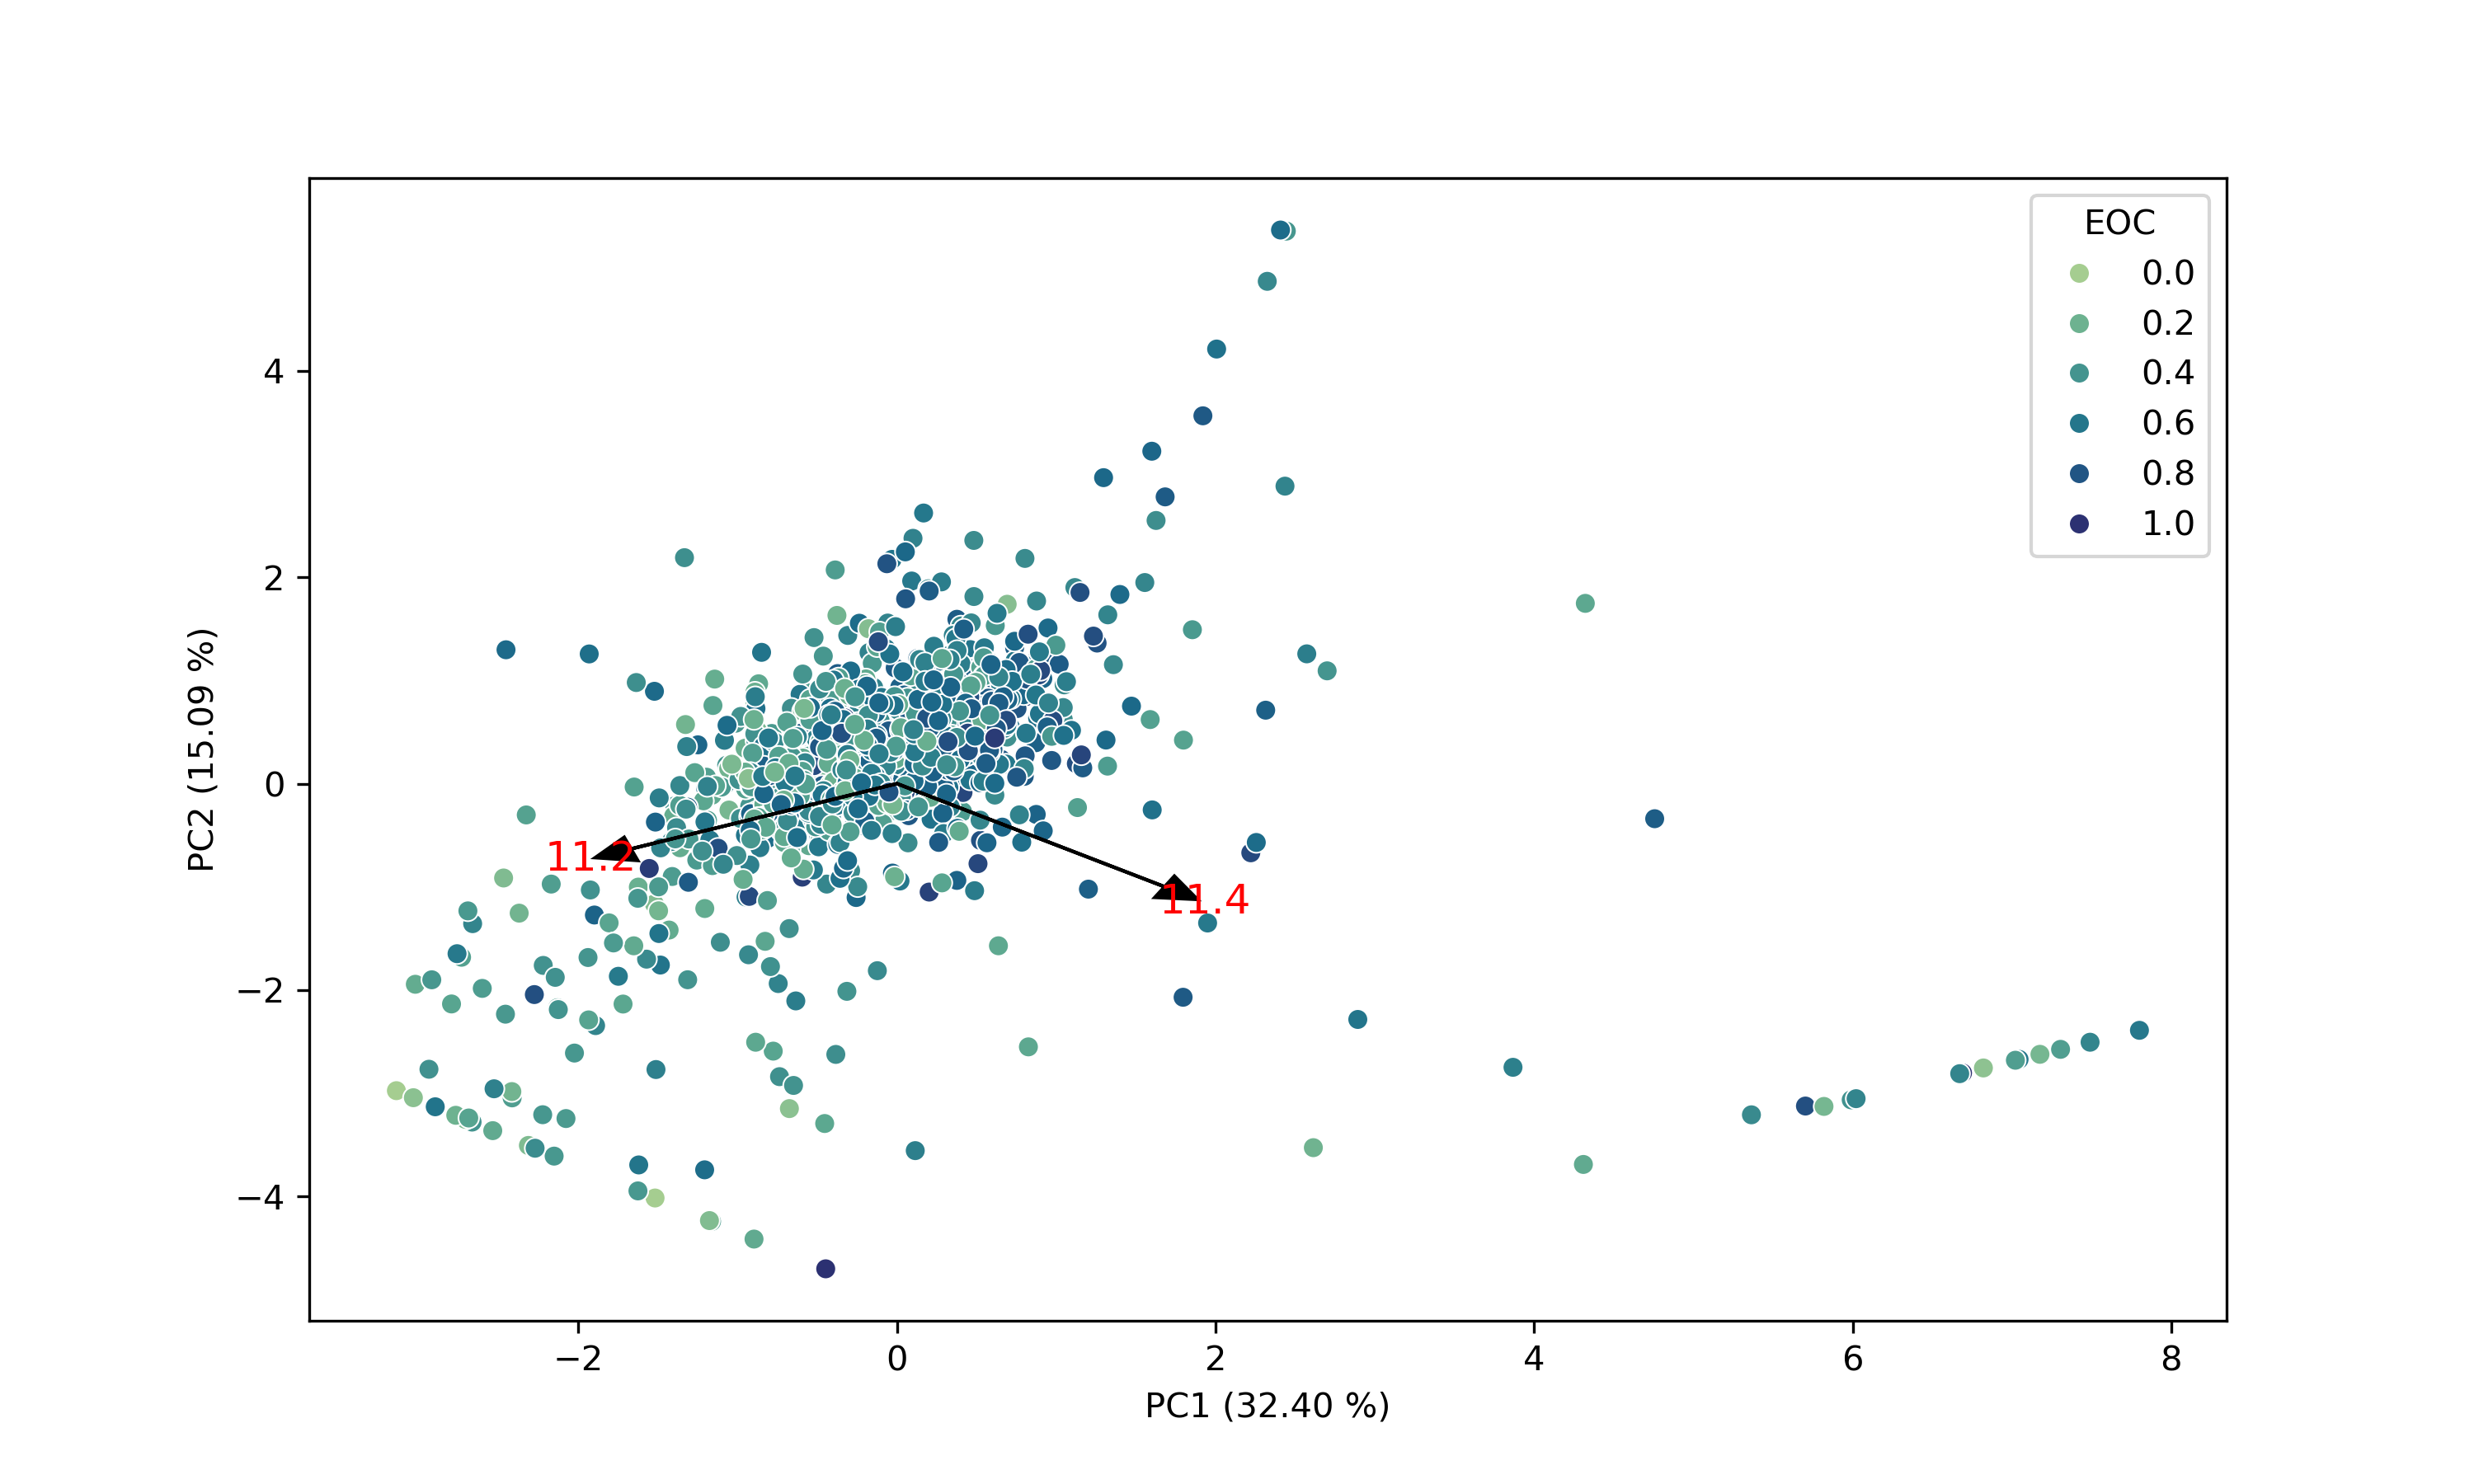
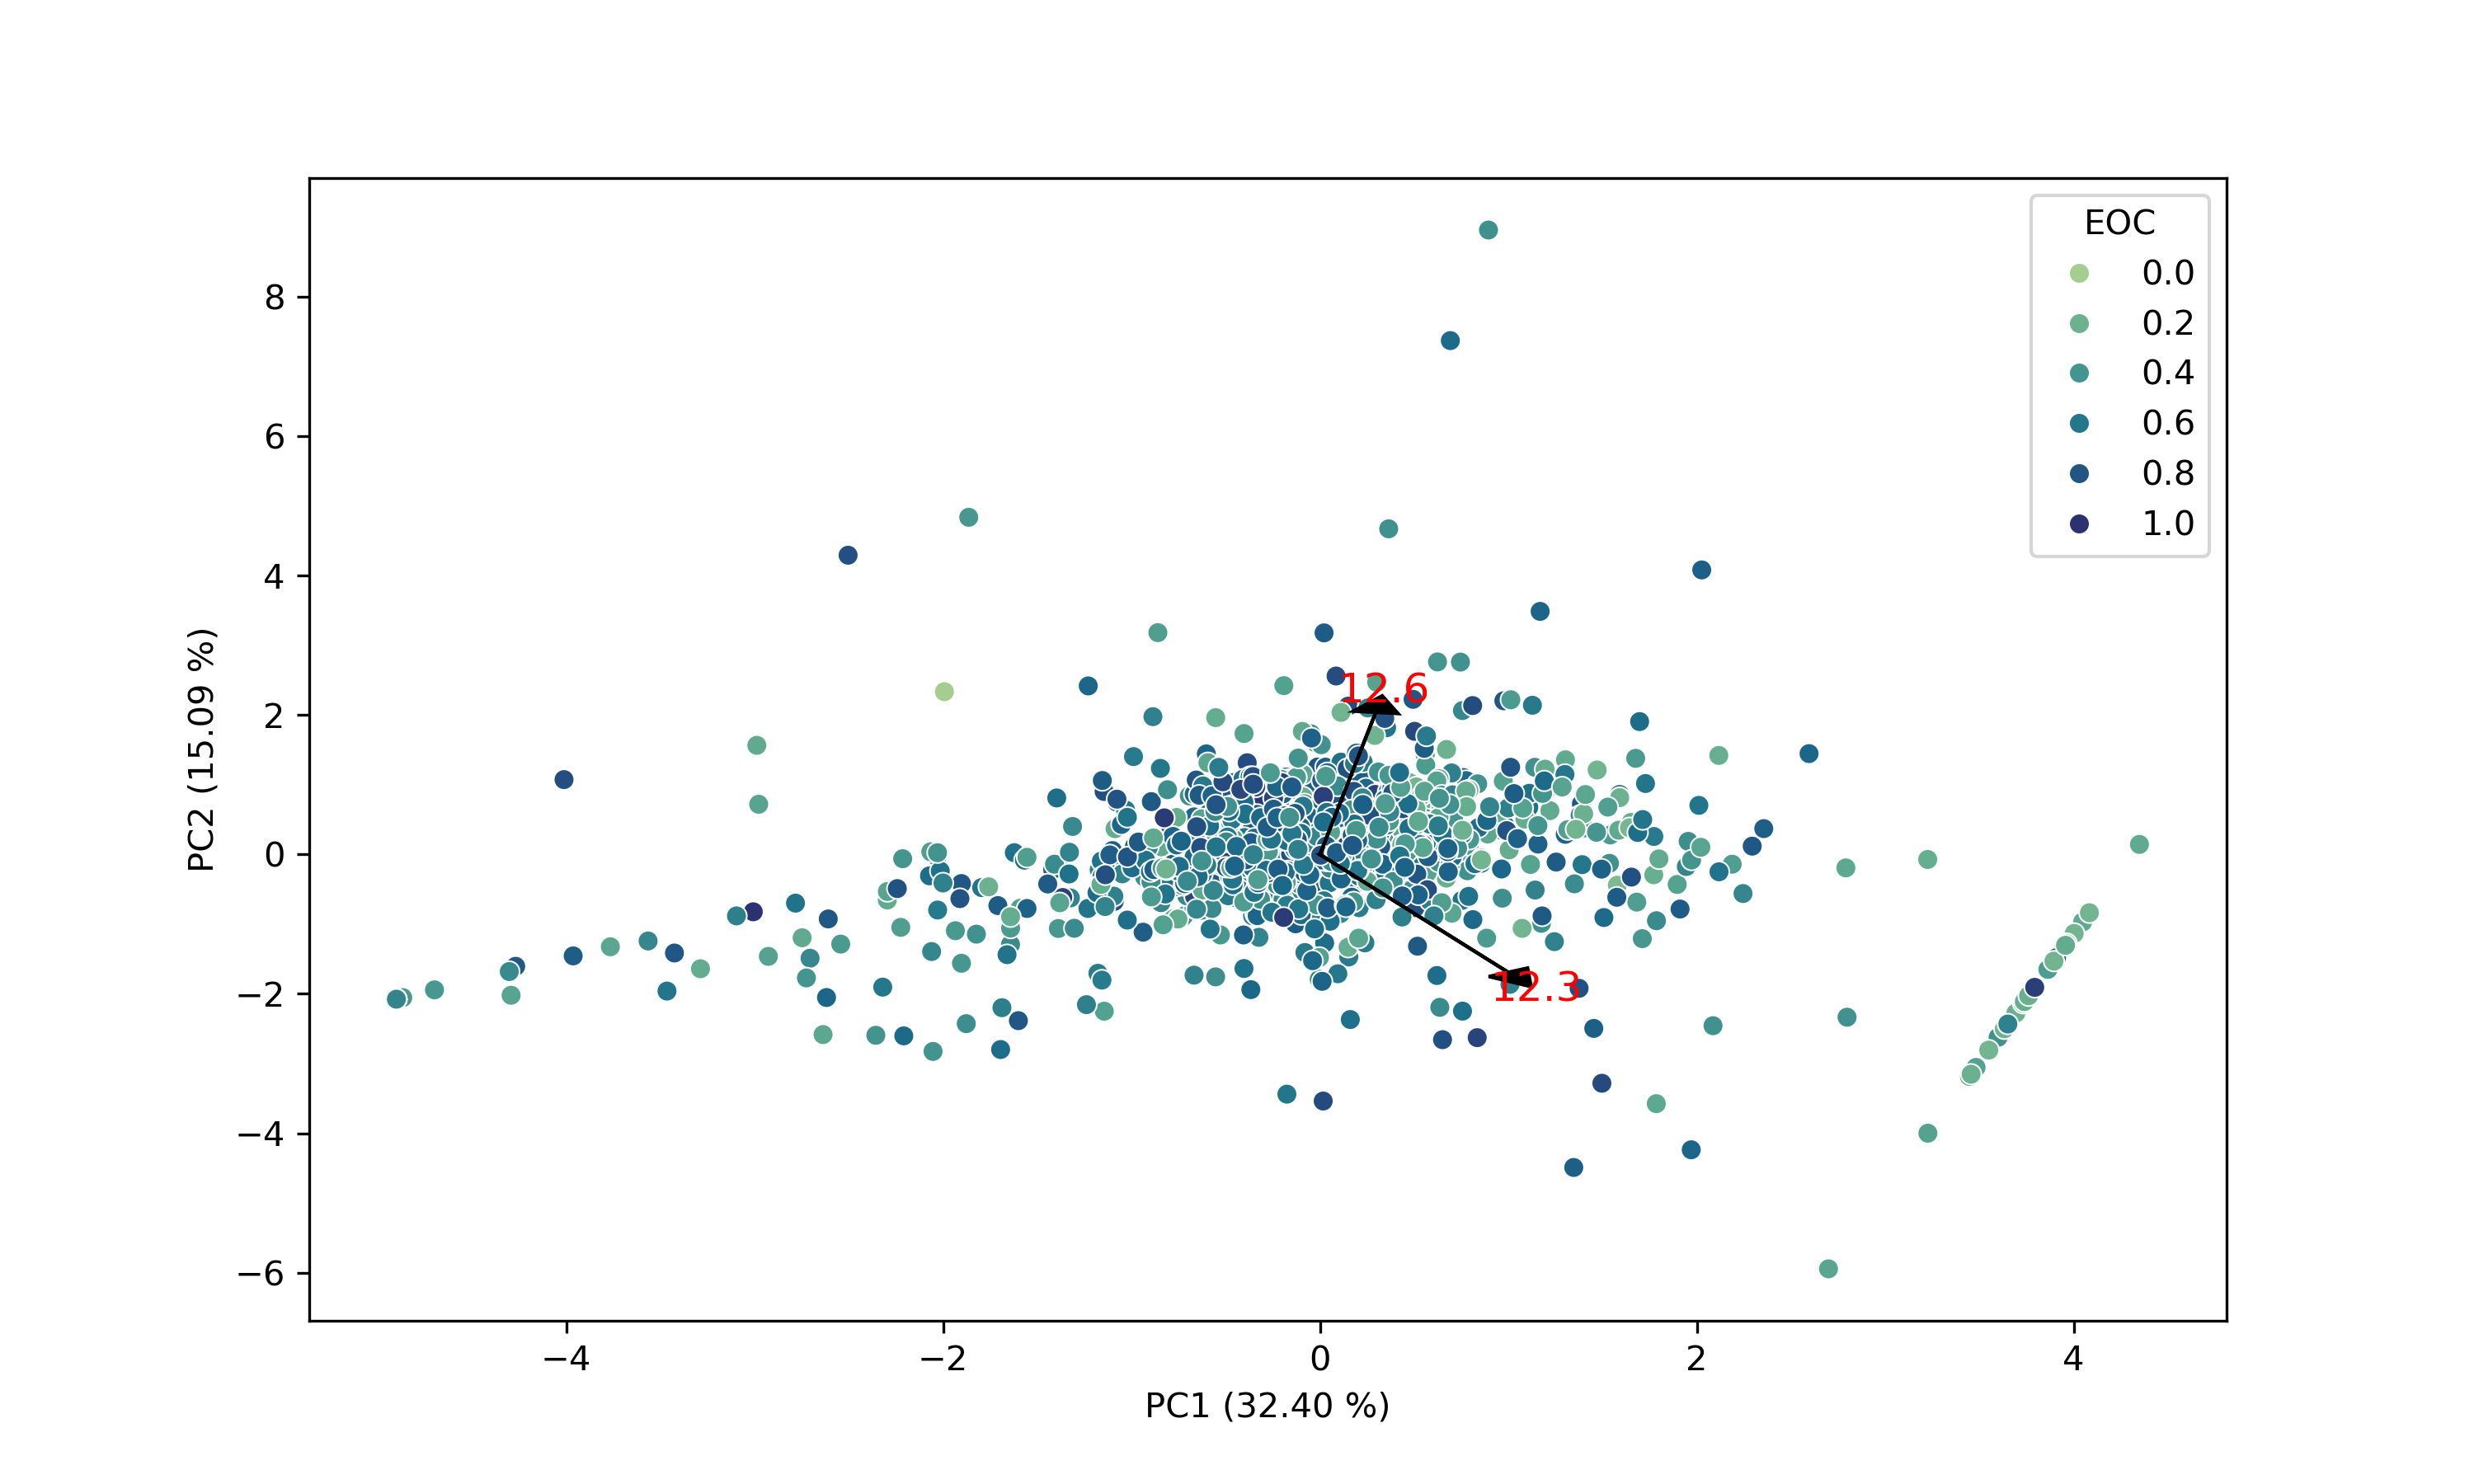
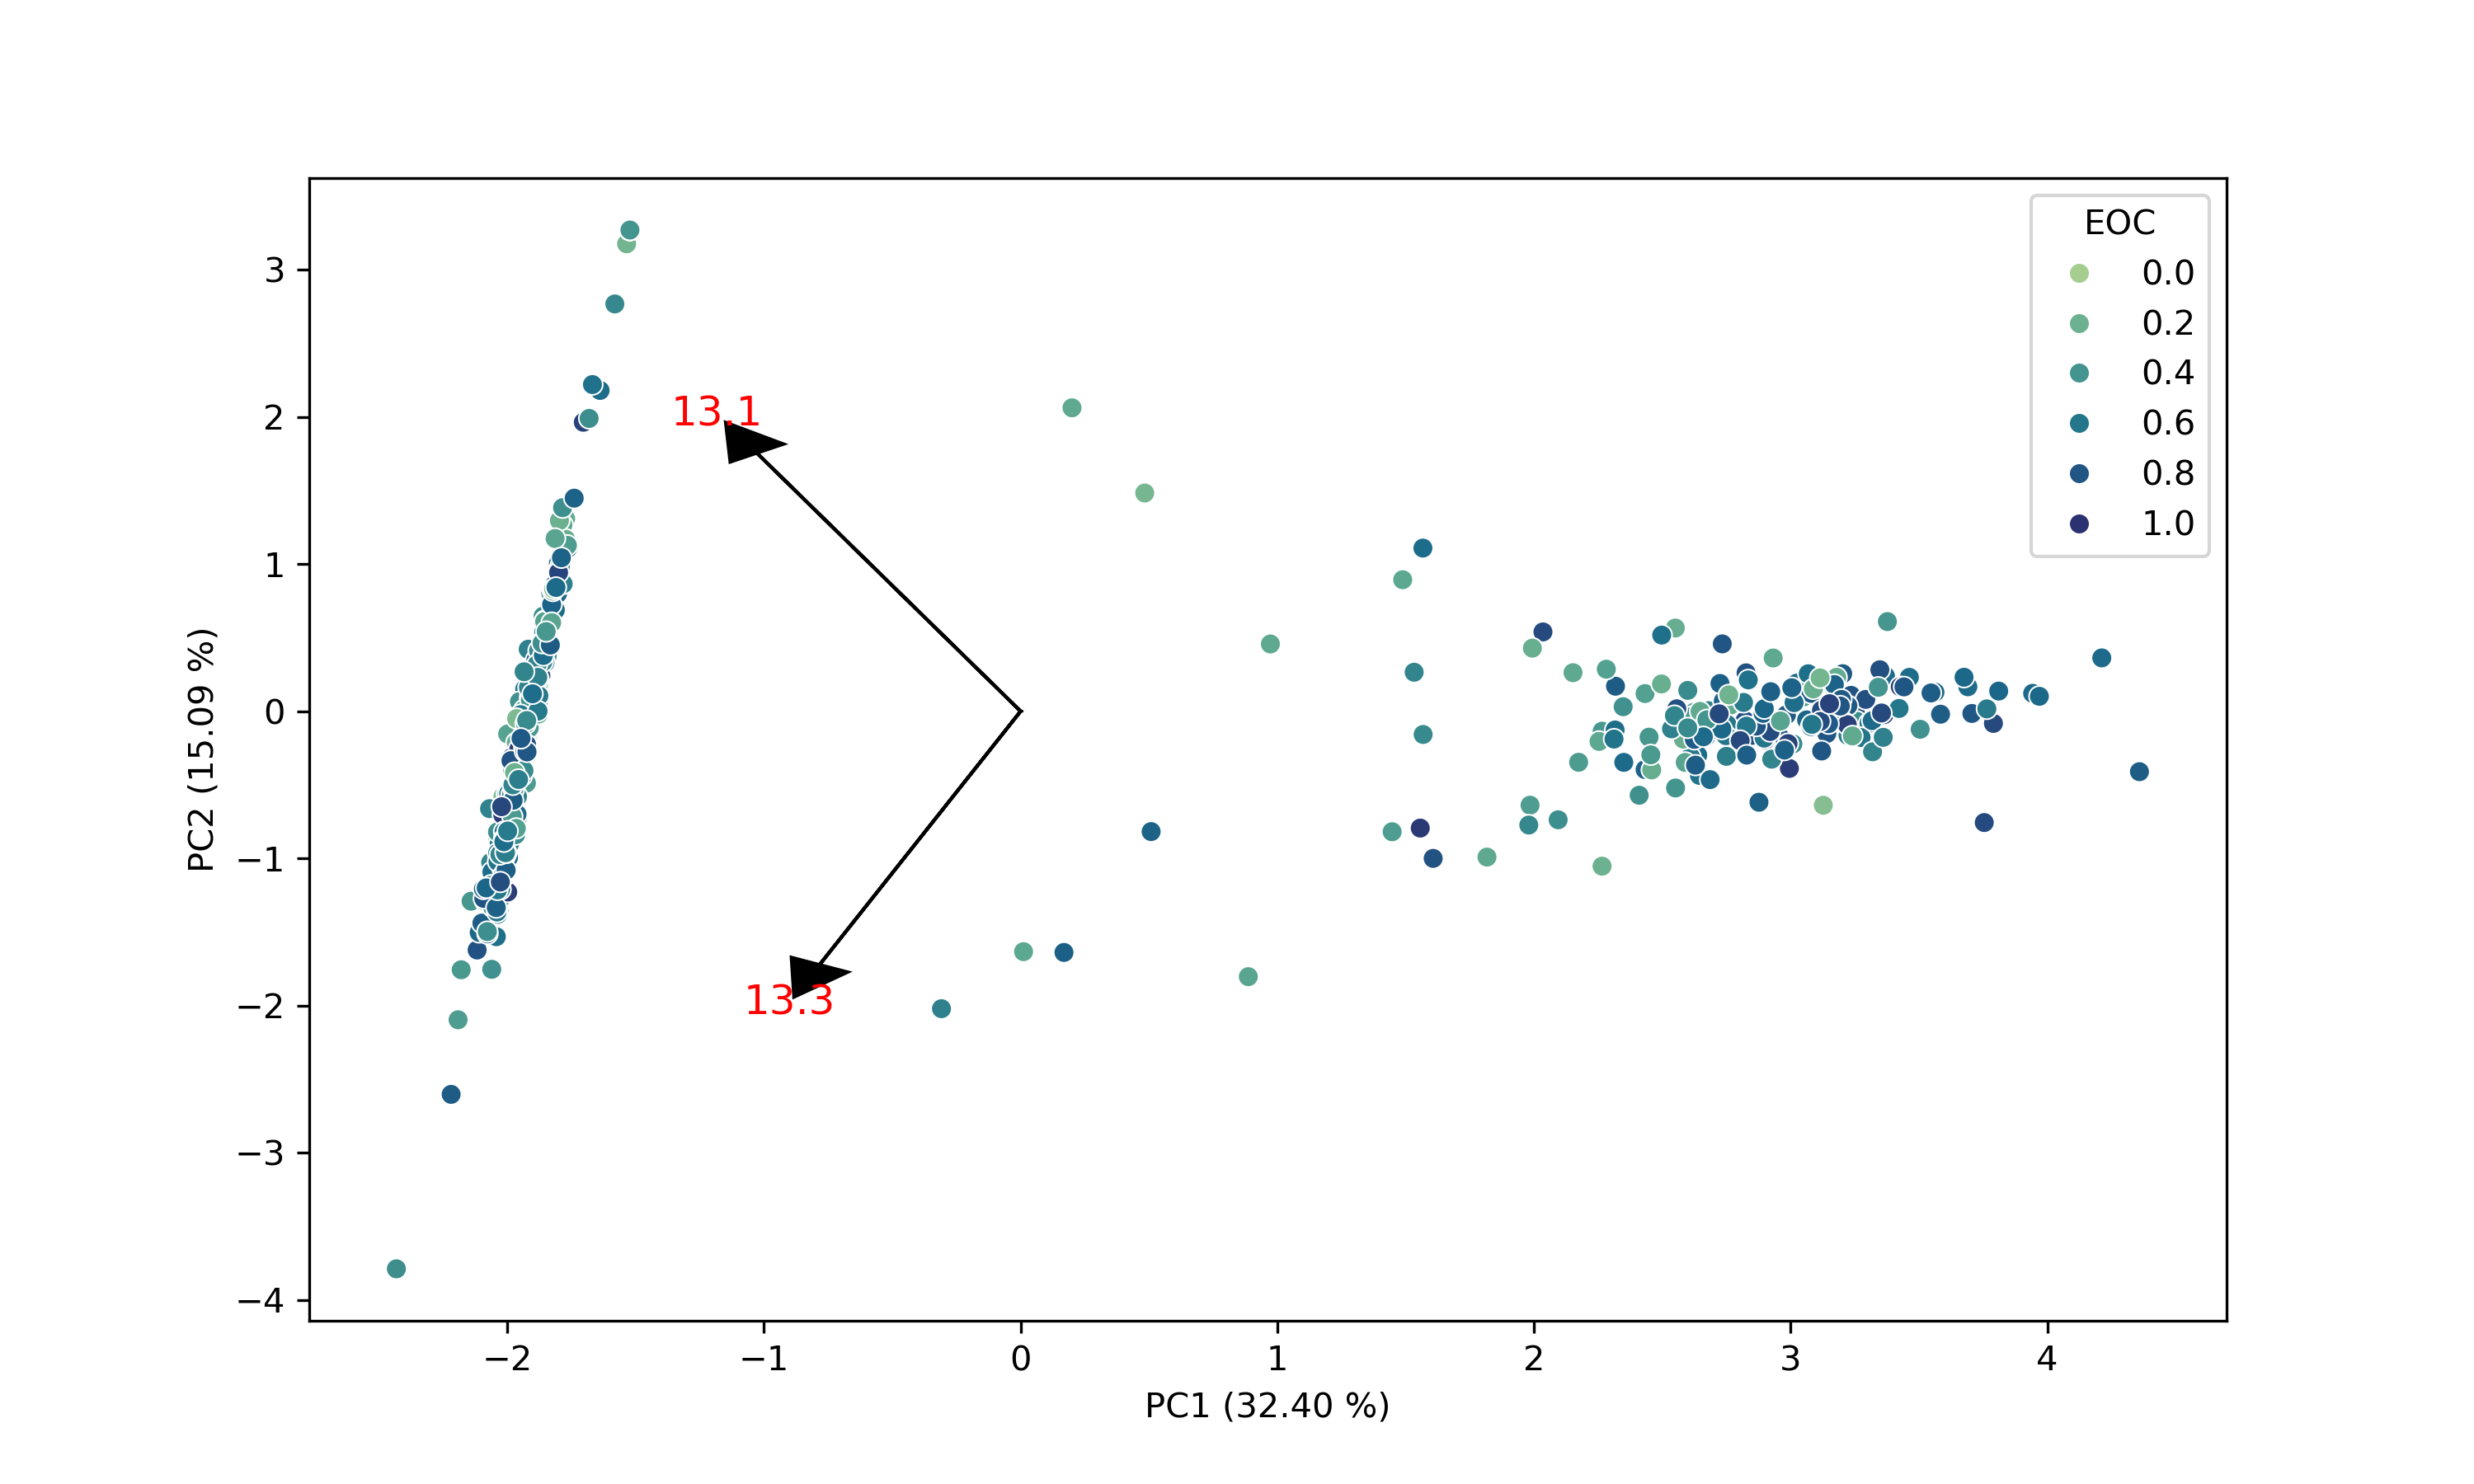
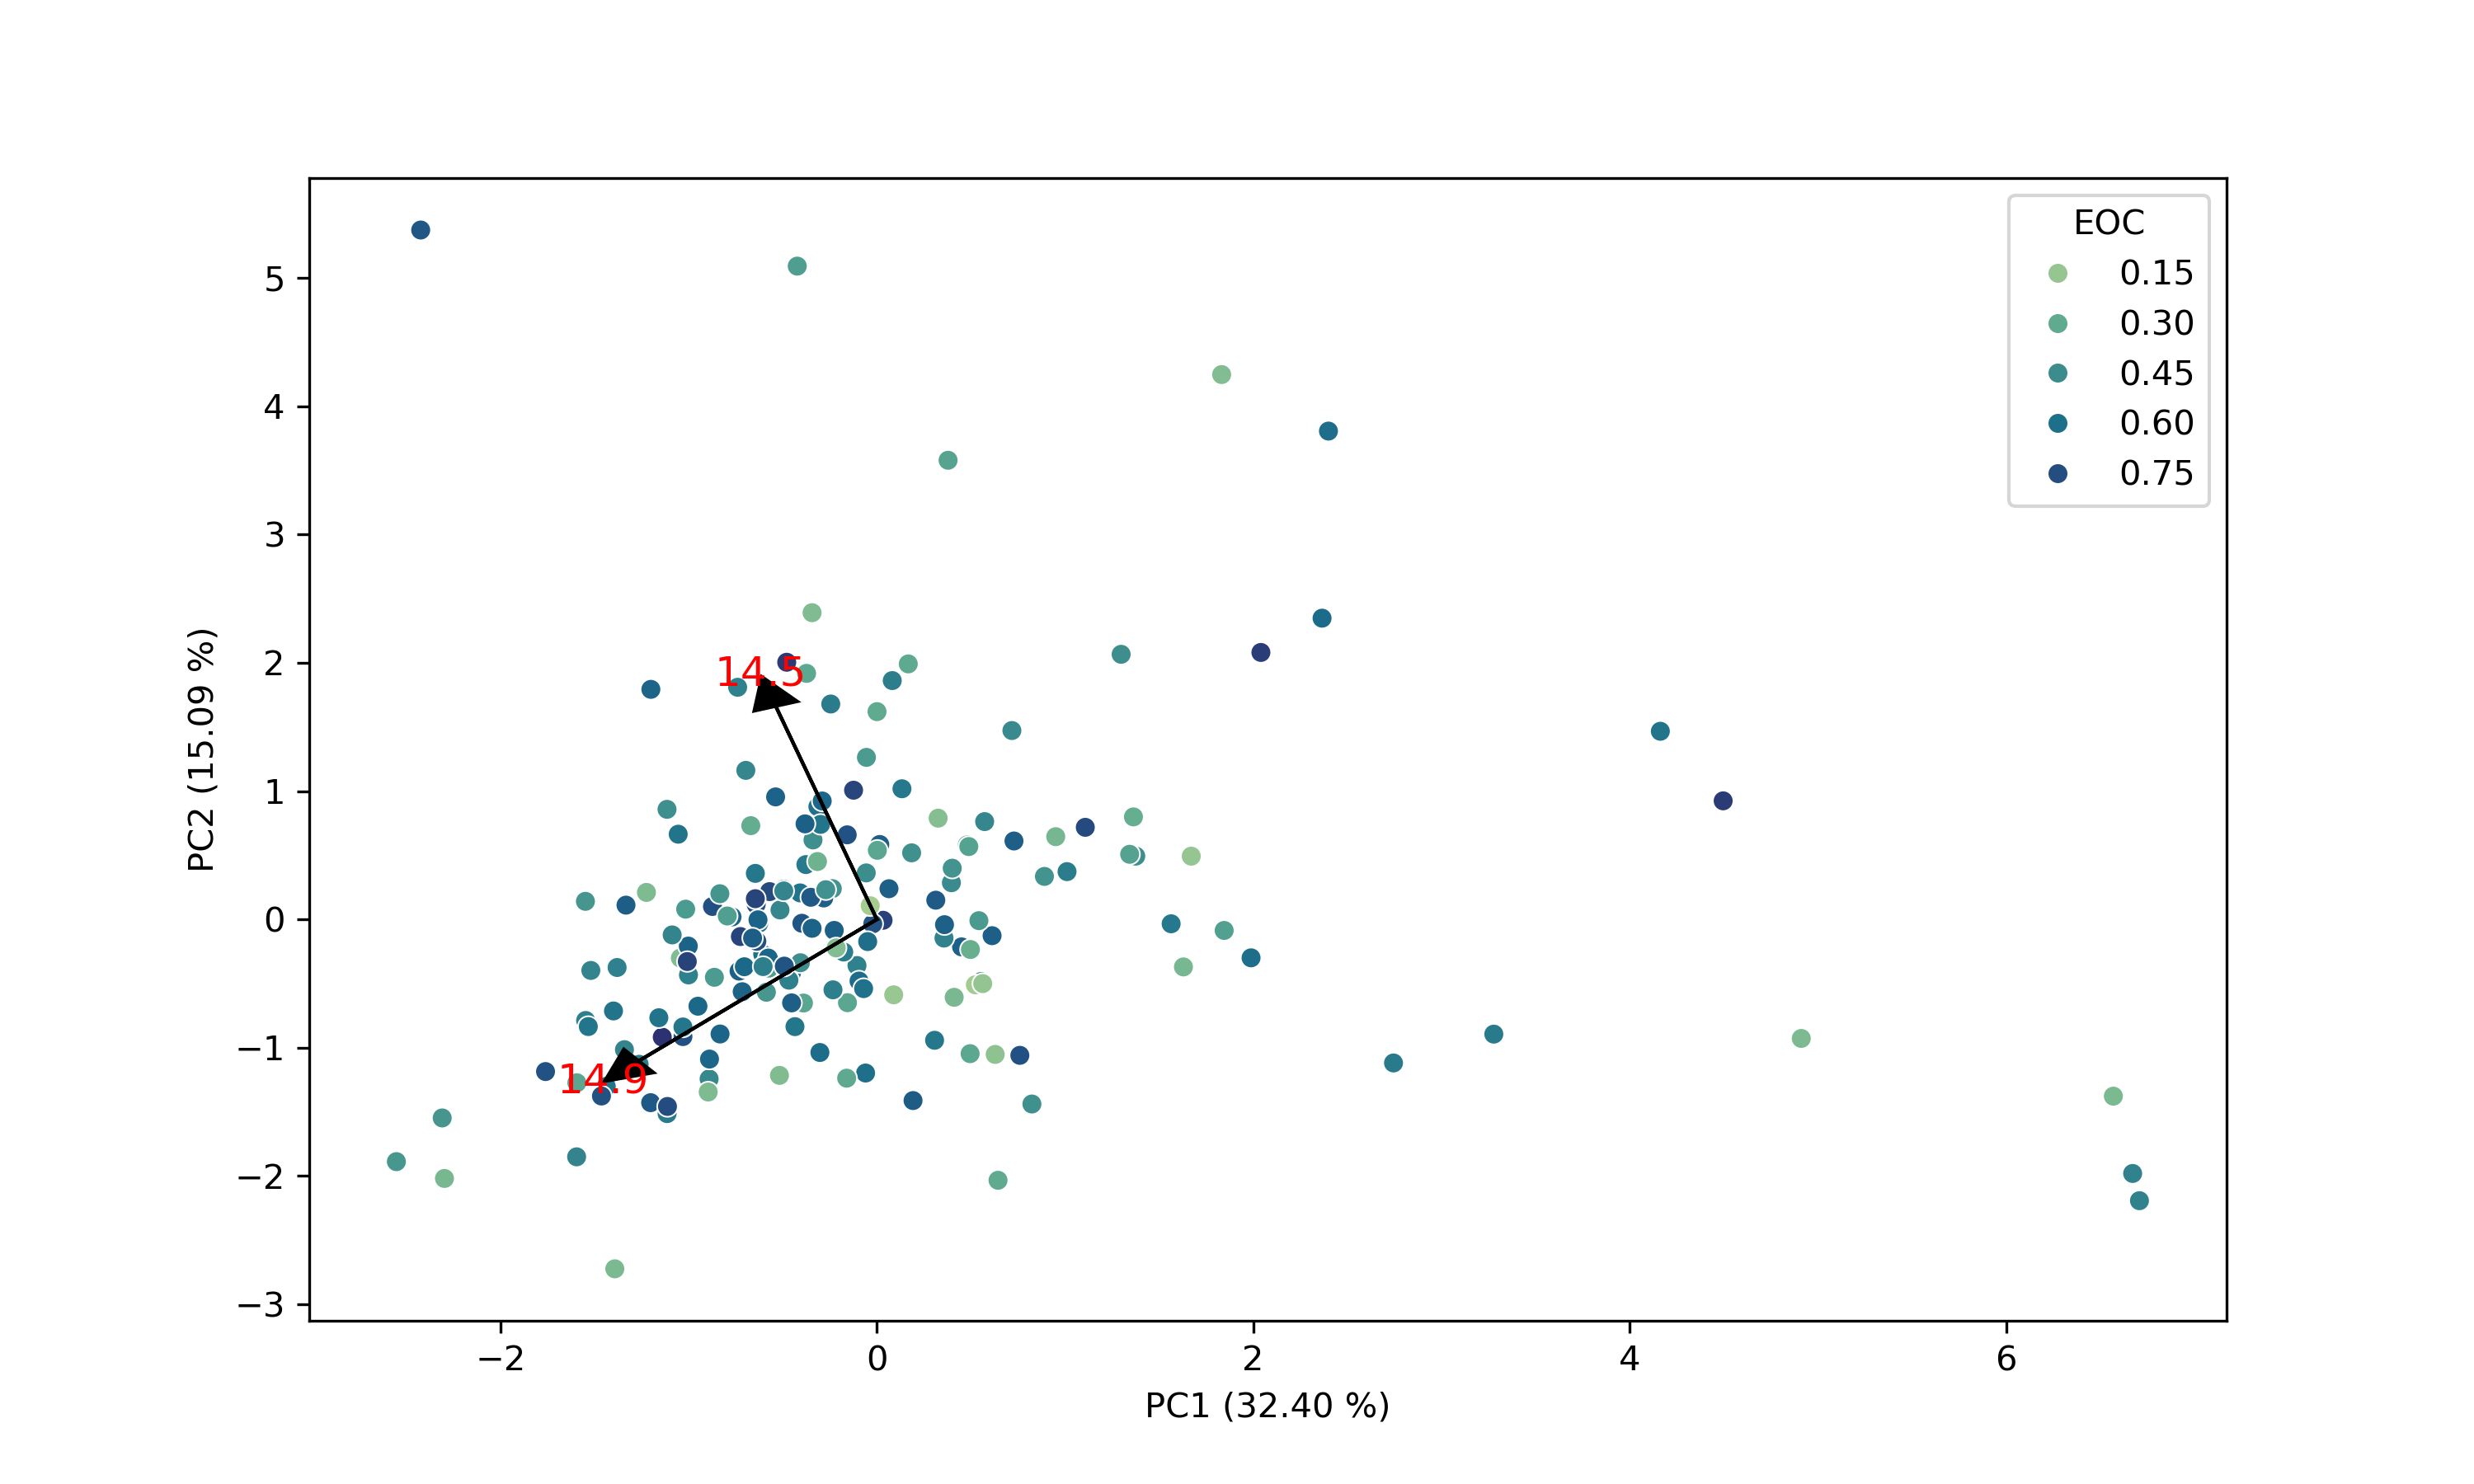
Using the relative section engagement ratio for each section, I used PCA to conduct dimension reduction on each chapter to visualize relationship between section emphasis and student performance. `
 |
 |
| Figure 9: 2-Component PCA Embedding of Chapter 1 |
Figure 10: 2-Component PCA Embedding of Chapter 2 |
 |
 |
| Figure 11: 2-Component PCA Embedding of Chapter 3 |
Figure 12: 2-Component PCA Embedding of Chapter 4 |
 |
 |
| Figure 13: 2-Component PCA Embedding of Chapter 5 |
Figure 14: 2-Component PCA Embedding of Chapter 6 |
 |
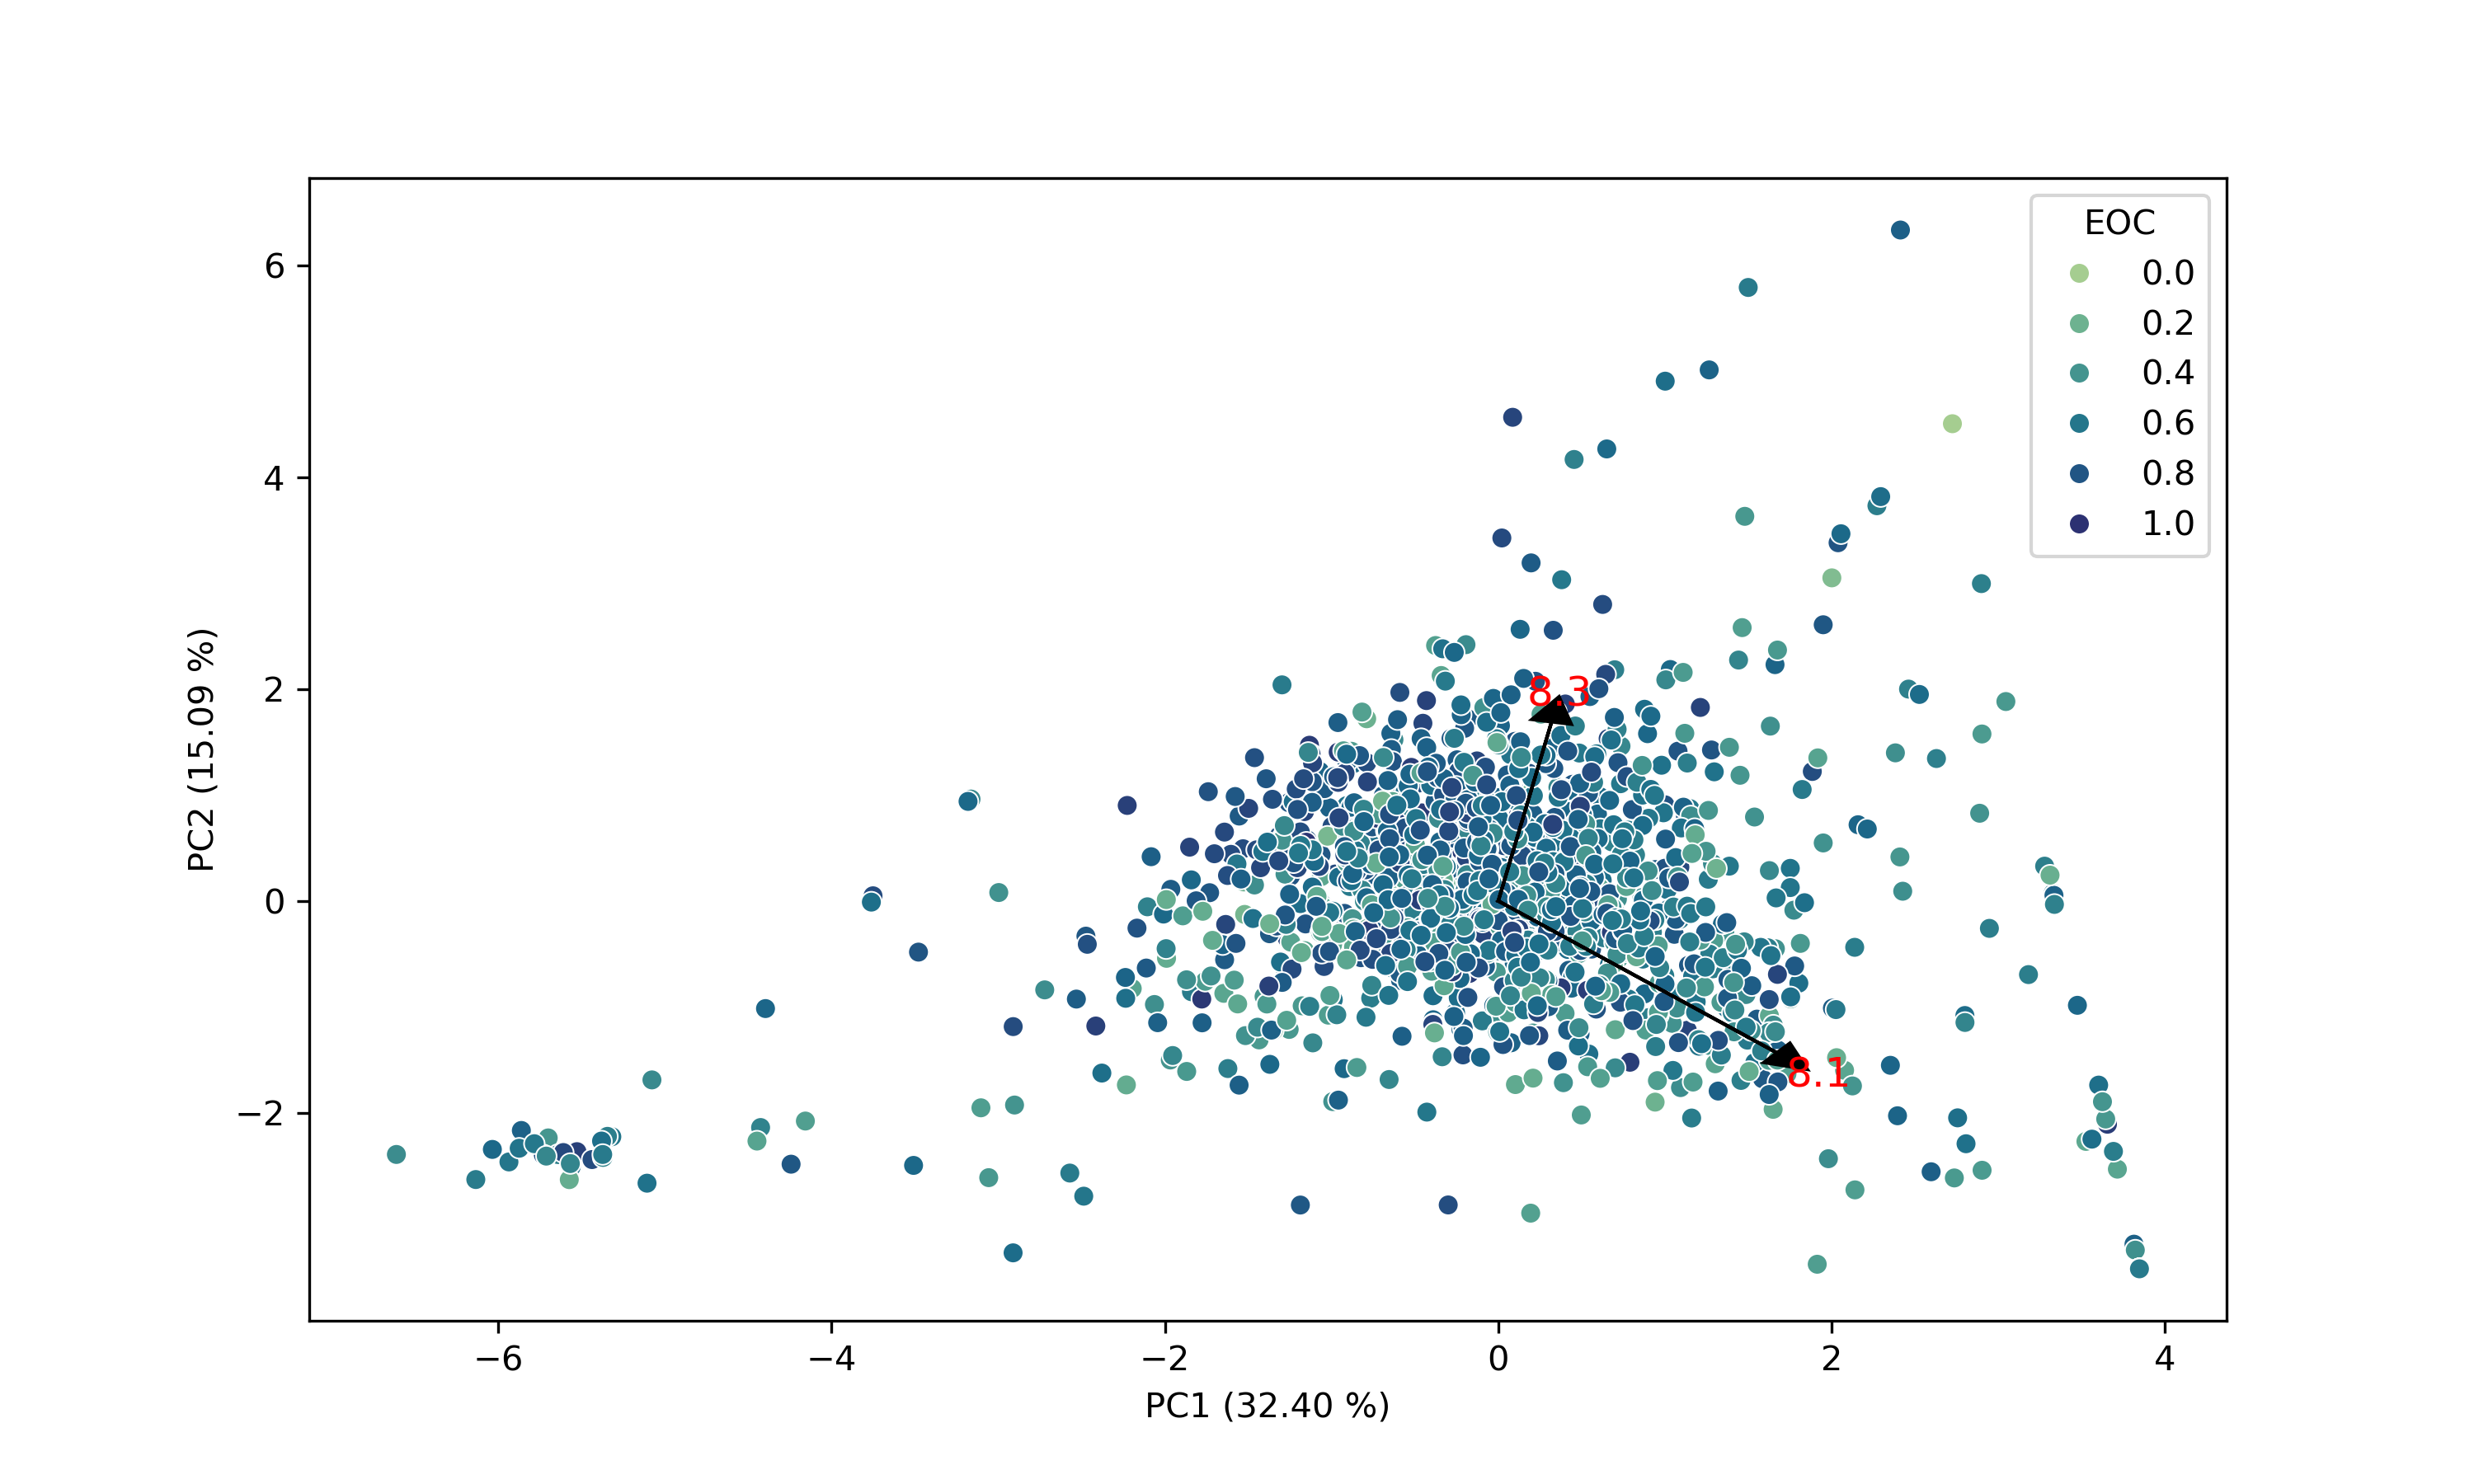 |
| Figure 15: 2-Component PCA Embedding of Chapter 7 |
Figure 16: 2-Component PCA Embedding of Chapter 8 |
 |
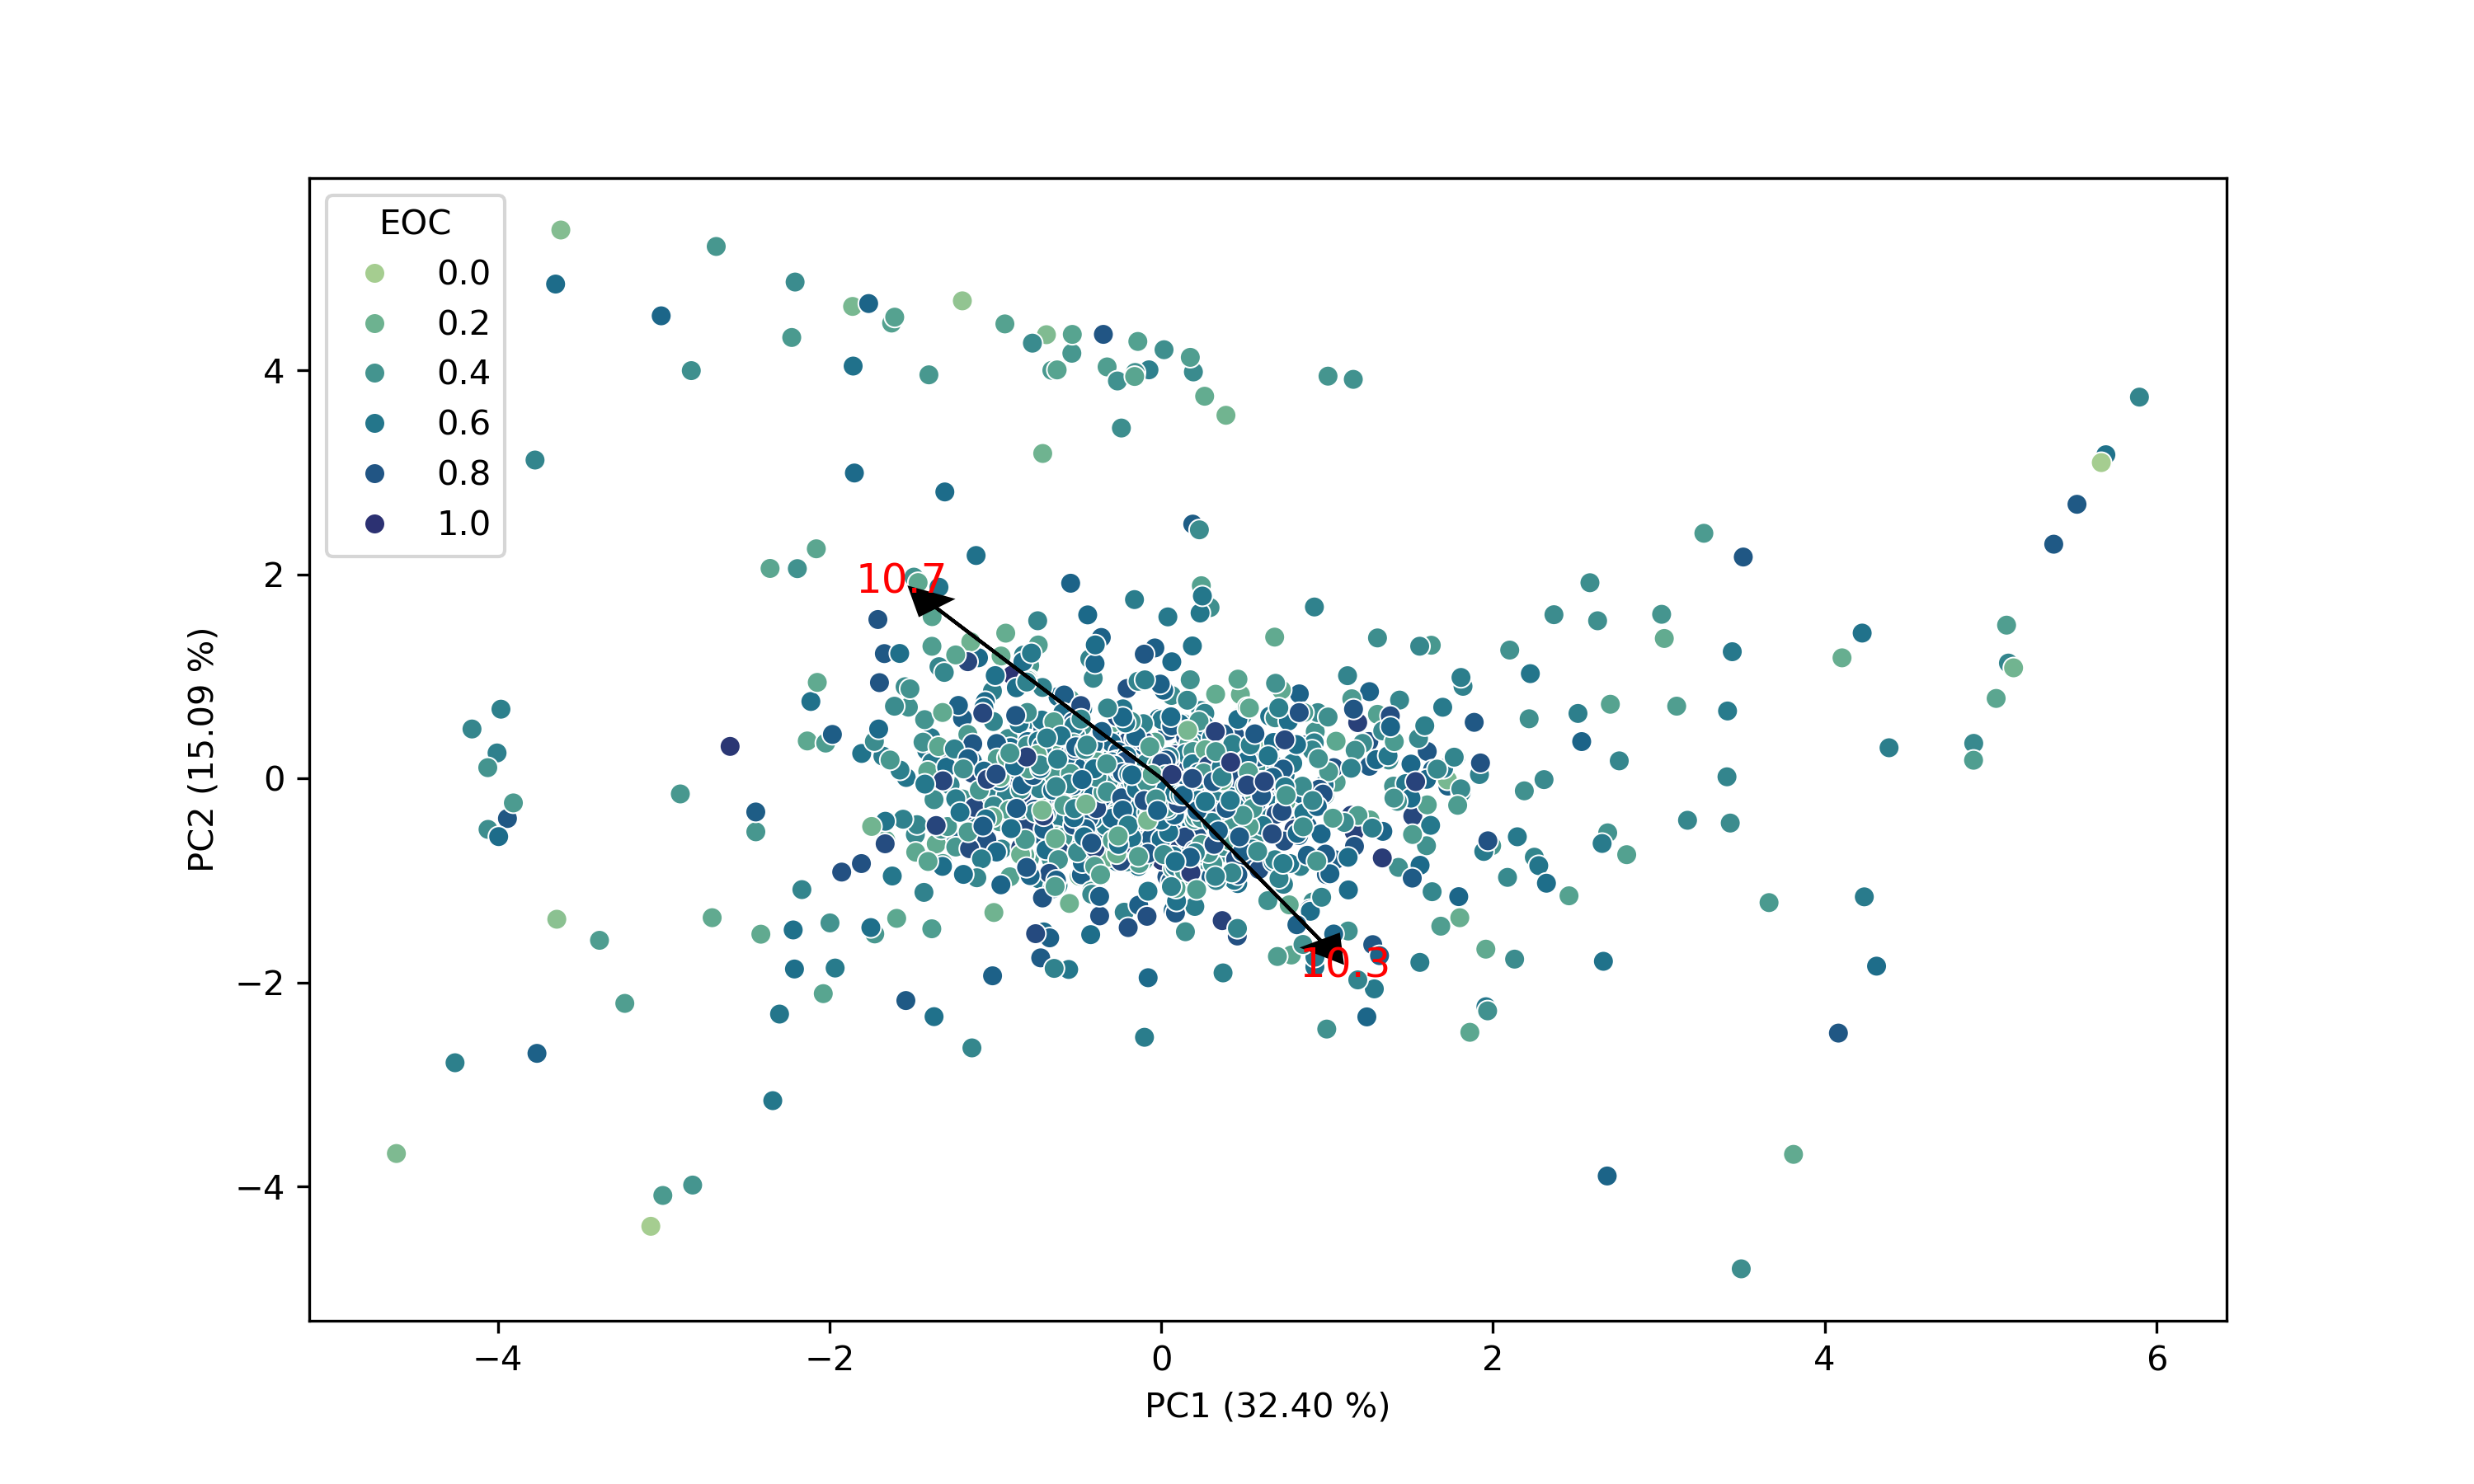 |
| Figure 17: 2-Component PCA Embedding of Chapter 9 |
Figure 18: 2-Component PCA Embedding of Chapter 10 |
 |
 |
| Figure 19: 2-Component PCA Embedding of Chapter 11 |
Figure 20: 2-Component PCA Embedding of Chapter 12 |
 |
 |
| Figure 21: 2-Component PCA Embedding of Chapter 13 |
Figure 22: 2-Component PCA Embedding of Chapter 14 |
 |
 |
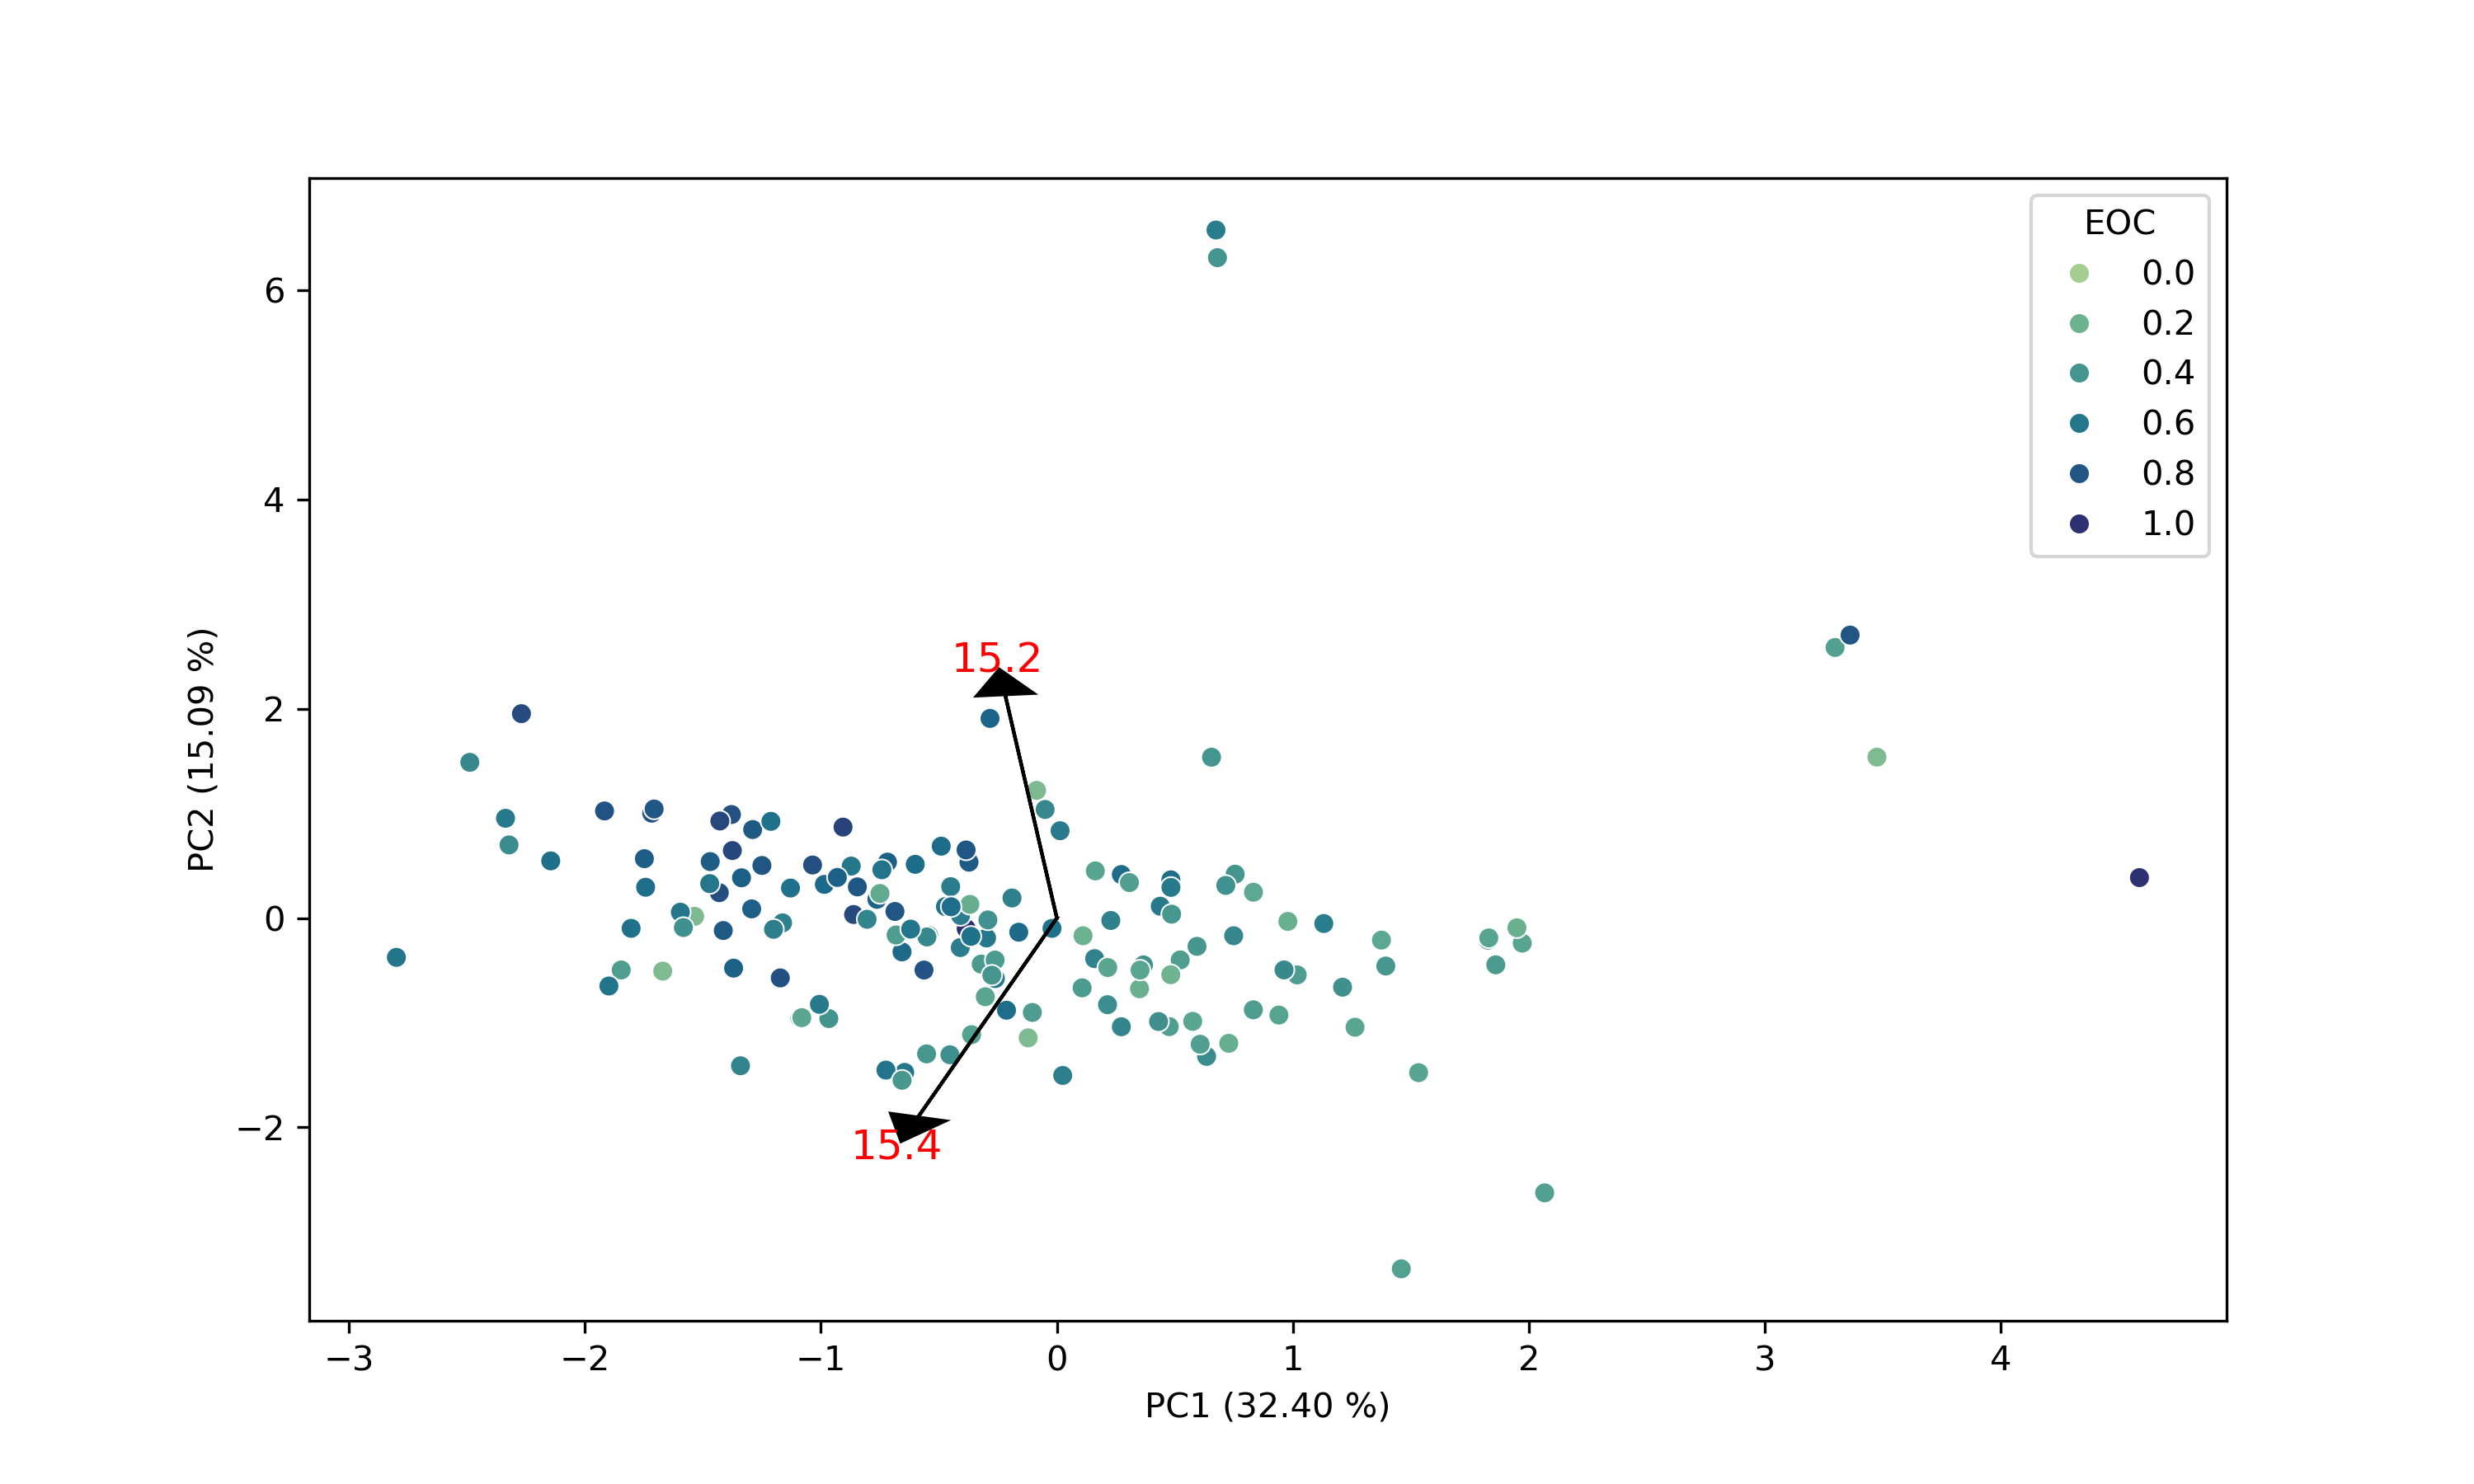
| Figure 23: 2-Component PCA Embedding of Chapter 15 |
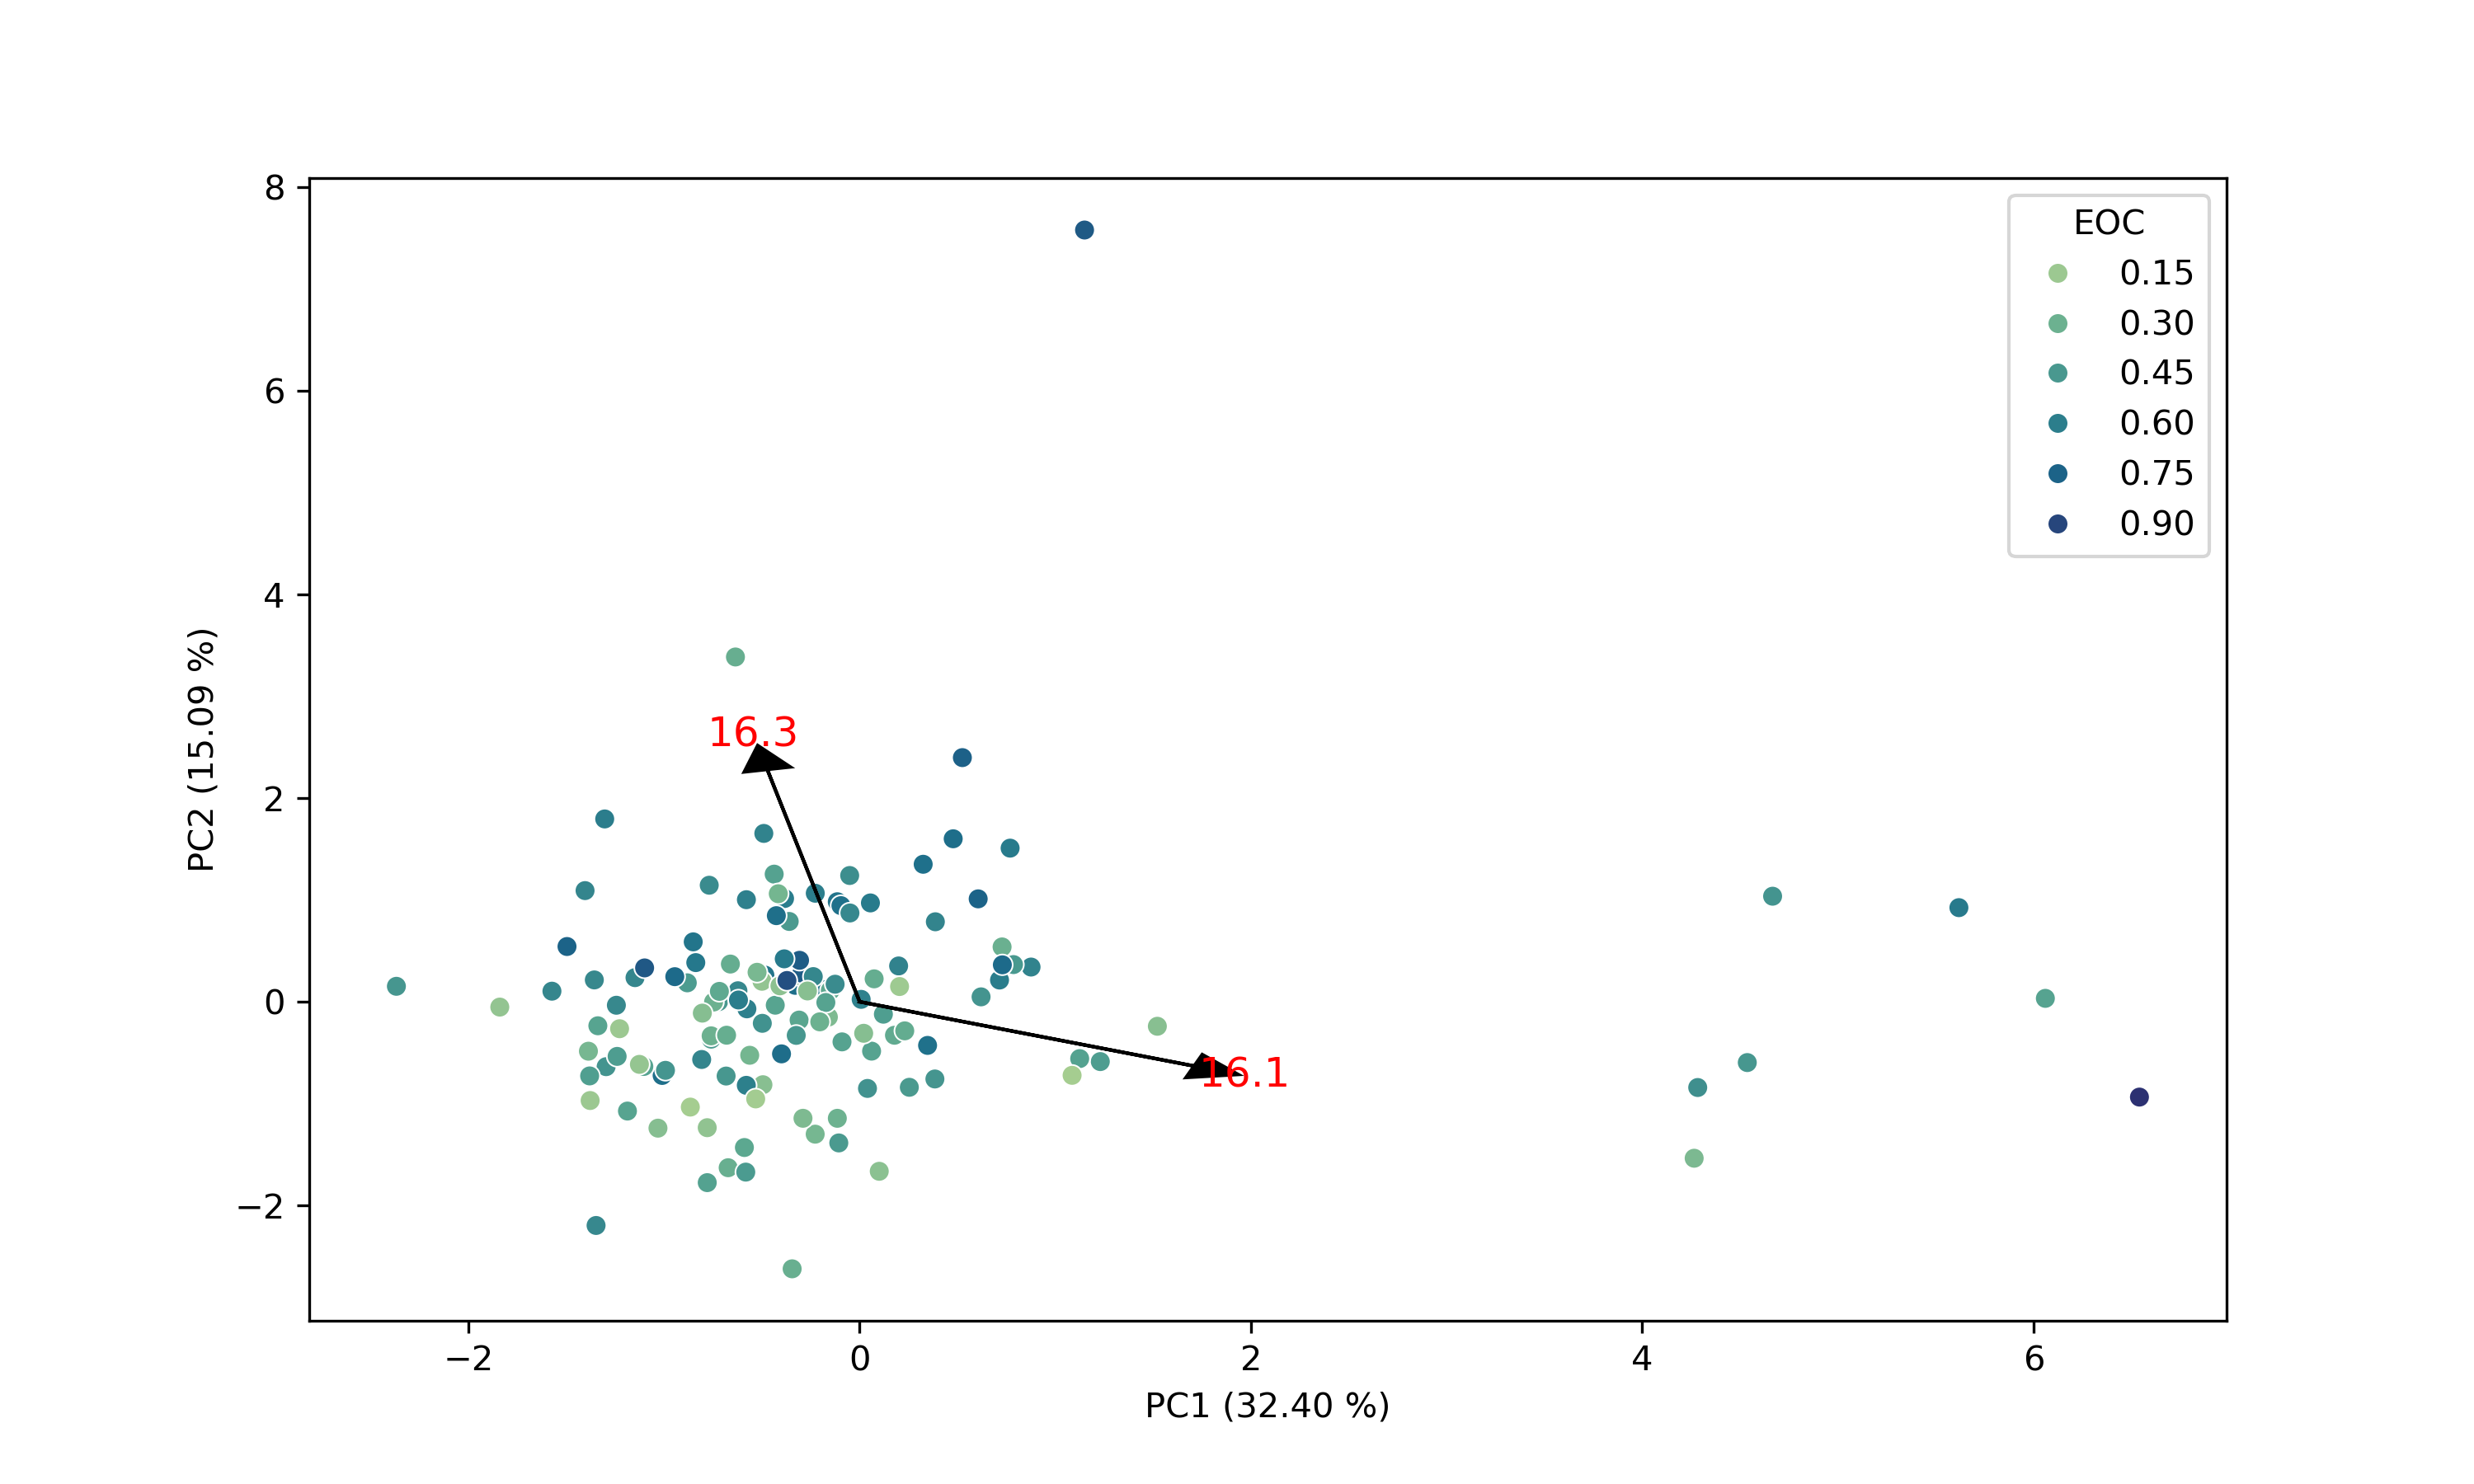
Figure 24: 2-Component PCA Embedding of Chapter 16 |